. 2006 Nov;15(11):2457-65.
doi: 10.1110/ps.062324206. Epub 2006 Sep 25.

Folding and misfolding mechanisms of the p53 DNA binding domain at physiological temperature

Affiliations

Folding and misfolding mechanisms of the p53 DNA binding domain at physiological temperature

James S Butler et al. Protein Sci. 2006 Nov.

Abstract

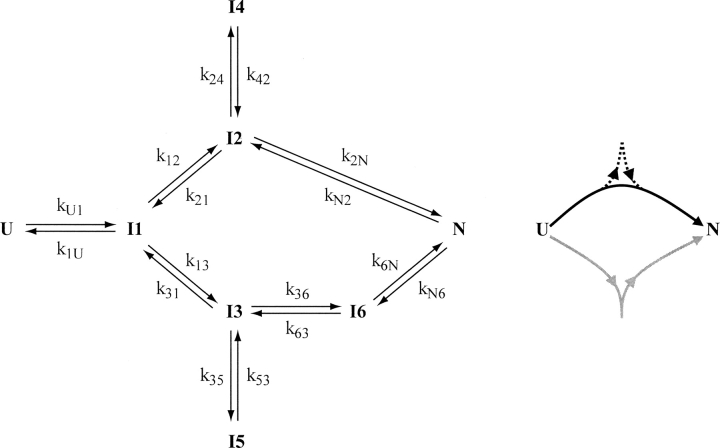
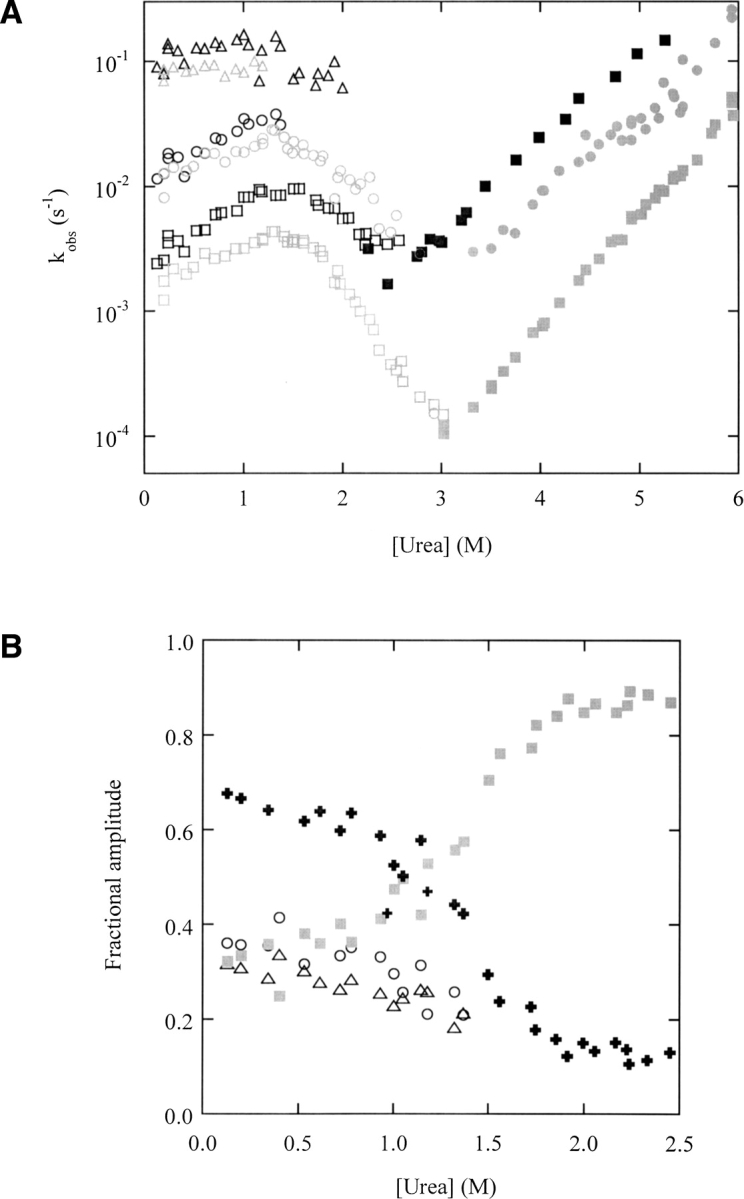
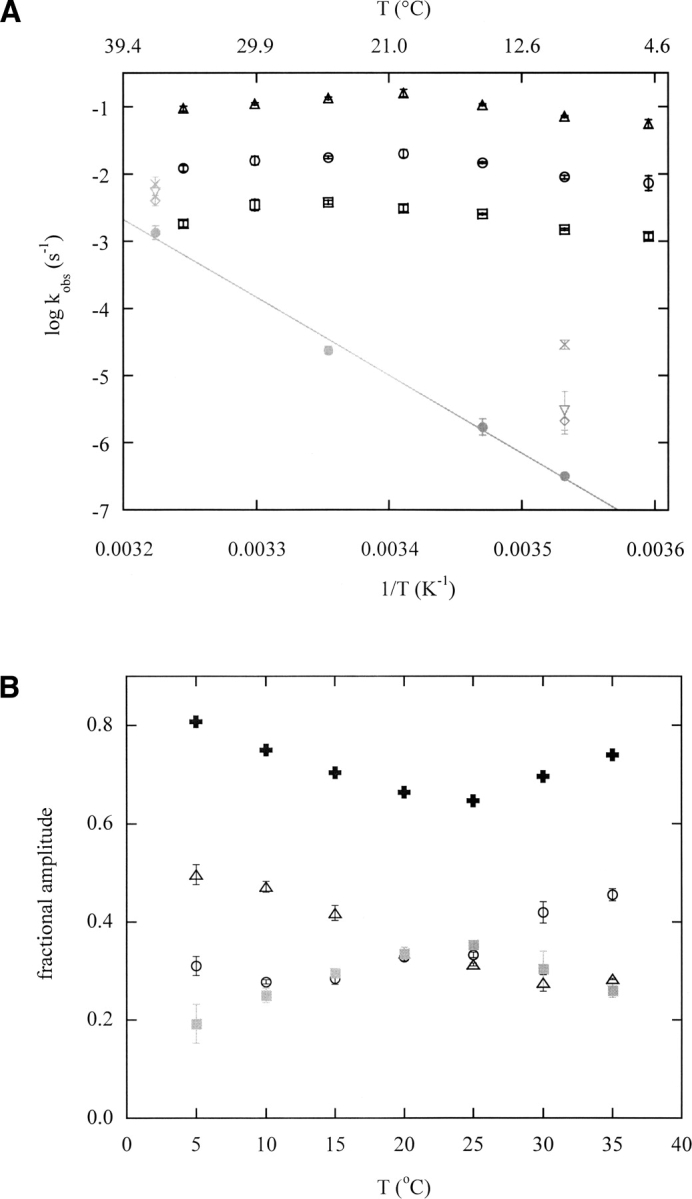
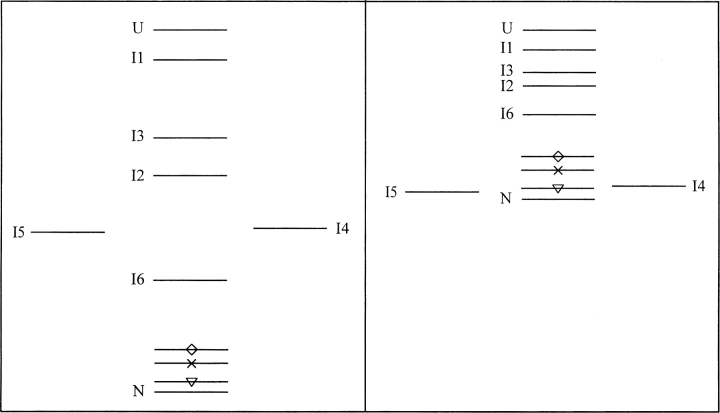
p53 modulates a large number of cellular response pathways and is critical for the prevention of cancer. Wild-type p53, as well as tumorigenic mutants, exhibits the singular property of spontaneously losing DNA binding activity at 37 degrees C. To understand the molecular basis for this effect, we examine the folding mechanism of the p53 DNA binding domain (DBD) at elevated temperatures. Folding kinetics do not change appreciably from 5 degrees C to 35 degrees C. DBD therefore folds by the same two-channel mechanism at physiological temperature as it does at 10 degrees C. Unfolding rates, however, accelerate by 10,000-fold. Elevated temperatures thus dramatically increase the frequency of cycling between folded and unfolded states. The results suggest that function is lost because a fraction of molecules become trapped in misfolded conformations with each folding-unfolding cycle. In addition, at 37 degrees C, the equilibrium stabilities of the off-pathway species are predicted to rival that of the native state, particularly in the case of destabilized mutants. We propose that it is the presence of these misfolded species, which can aggregate in vitro and may be degraded in the cell, that leads to p53 inactivation.


Figures

Scheme 1.
Scheme 1.
DBD folding mechanism (left) and schematic representation of fast and slow-folding channels (right). The fast and slow channels are the upper and lower pathways, respectively, on the left, and are colored black and gray on the right. Folding tracks are depicted in the right panel as follows: track a, solid black line; track b, solid black and dashed black lines; track c, gray line. Track d is not shown. Microscopic rate constants that quantitatively reproduce kobs, a, kobs, b, and kobs, c and their associated amplitudes at 10°C are as follows (in units of sec−1): kU1 = 200, k1U = 30, k12 = 1, k21 = 0.001, k13 = 0.4, k31 = 0.01, k24 = 0.04, k42 = 0.02, k35 = 0.1, k53 = 0.02, k2N = 0.08, kN2 = 12×10−5, k36 = 0.001, k63 = 82×10−7, k6N = 0.3, kN6 = 0.005.
Figure 1.
Figure 1.
Thermal denaturation of DBD monitored by Trp fluorescence. DBD (0.2 μM) was heated at the indicated temperatures for 10 min in 25 mM HEPES (pH 7.0), 0.15 M KCl, and 1 mM TCEP unless otherwise indicated. Variants are denoted by the following symbols: closed circles, wild type; open circles, wild type with no KCl; inverted triangles, G245S; x-symbols, R249S; diamonds, R282Q. Lines are meant to guide the eye only.
Figure 2.
Figure 2.
Direct folding (A) and interrupted folding (B) of wild-type DBD, monitored by Trp fluorescence. Data in panel A were obtained at 25°C (0.2 M urea). The inset shows residuals from two-exponential (black) and three-exponential (gray) curve fits, respectively. The axes of the inset have the same units as the data plot. Open and closed symbols in B represent folding at 10°C and 25°C, respectively (0.35 M urea). Lines are best fits of the data to a three-exponential function, with kobs,a fixed as described in the text.
Figure 3.
Figure 3.
Unfolding of wild-type DBD (3.14 M urea) at 10°C. The inset shows residuals from fitting the data to a one-exponential function. The axes of the inset have the same units as the data plot.
Figure 4.
Figure 4.
(A) Urea dependence of observed folding (open symbols) and unfolding (closed symbols) rates of wild-type DBD, obtained by fitting DF fluorescence data recorded at 10°C (gray) and 25°C (black); 10°C data are taken from (Butler and Loh 2005). Symbols are as follows: open triangles, kobs,a; open circles, kobs,b; open squares, kobs,c; closed circles, fast unfolding rate; closed squares, slow unfolding rate (only one unfolding phase is observed at ≥25°C; see text). (B) Urea dependence of direct folding fluorescence amplitudes of wild-type DBD at 25°C. Symbols are as follows: open triangles, Aa; open circles, Ab; filled squares, Ac; filled plus signs, sum of Aa and Ab. The amplitudes of the fast and slow channels are indicated by black and gray filled symbols, respectively.
Figure 5.
Figure 5.
(A) Temperature dependence of observed folding rates (black symbols, 0.23 M urea) and unfolding rates (gray symbols, extrapolated to zero denaturant) for wild-type and mutant DBD, obtained by fitting DF fluorescence data. Rates of the slow unfolding phase are plotted. kobs,a, kobs,b, and kobs,c are represented by triangles, circles, and squares, respectively, as in ▶. Unfolding rates for wild type, G245S, R249S, and R282Q are filled circles, inverted triangles, crosses, and diamonds, respectively, as in ▶. The line is the linear fit of the wild-type DBD unfolding rates. (B) Temperature dependence of DF fluorescence amplitudes for wild-type DBD. Amplitudes of tracks a, b, and c are indicated by the same symbols as in A; filled plus signs represent the sum of Aa and Ab. Black and gray symbols denote fast and slow channel amplitudes, respectively. Error bars in A and B show standard errors of the mean (n = 5).
Figure 6.
Figure 6.
Schematic free energy diagrams for DBD folding at 10°C (left) and 37°C (right). On-pathway intermediates lie in the vertical line between unfolded and native states. Misfolded species I4 and I5 are placed to the left and right of that line. Bars with symbols indicate approximate free energies of mutant native states. Inverted triangles, G245S; x-symbols, R249S; diamonds, R282Q.

Similar articles

Cited by

References

    1. Alexander, P., Orban, J., and Bryan, P. 1992. Kinetic analysis of folding and unfolding the 56 amino acid IgG-binding domain of streptococcal protein G. Biochemistry 31 7243–7248. - PubMed
    1. Bartek, J., Bartkova, J., Vojtesek, B., Staskova, Z., Lukas, J., Rejthar, A., Kovarik, J., Midgley, C.A., Gannon, J.V., and Lane, D.P. 1991. Aberrant expression of the p53 oncoprotein is a common feature of a wide spectrum of human malignancies. Oncogene 6 1699–1703. - PubMed
    1. Bell, S., Klein, C., Muller, L., Hansen, S., and Buchner, J. 2002. p53 contains large unstructured regions in its native state. J. Mol. Biol. 322 917–927. - PubMed
    1. Bullock, A.N., Henckel, J., DeDecker, B.S., Johnson, C.M., Nikolova, P.V., Proctor, M.R., Lane, D.P., and Fersht, A.R. 1997. Thermodynamic stability of wild-type and mutant p53 core domain. Proc. Natl. Acad. Sci. 94 14338–14342. - PMC - PubMed
    1. Bullock, A.N., Henckel, J., and Fersht, A.R. 2000. Quantitative analysis of residual folding and DNA binding in mutant p53 core domain: Definition of mutant states for rescue in cancer therapy. Oncogene 19 1245–1256. - PubMed