

Genetic basis of murine responses to hyperoxia-induced lung injury
- PMID: 17001473
- PMCID: PMC1892207
- DOI: 10.1007/s00251-006-0147-9
Genetic basis of murine responses to hyperoxia-induced lung injury
Abstract
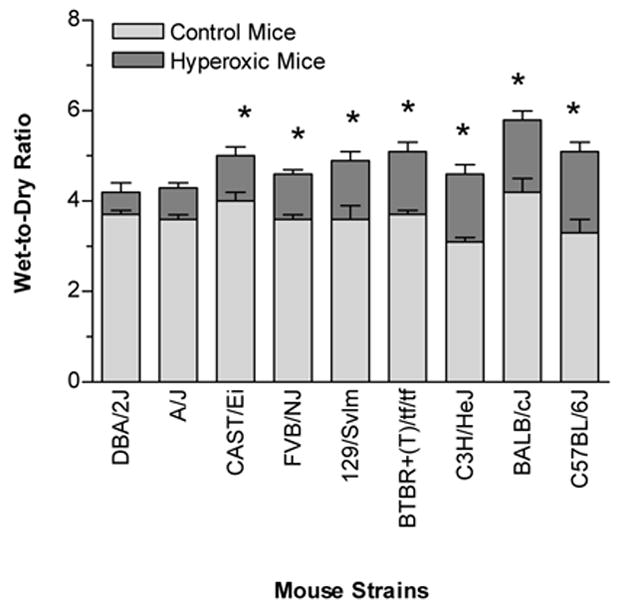
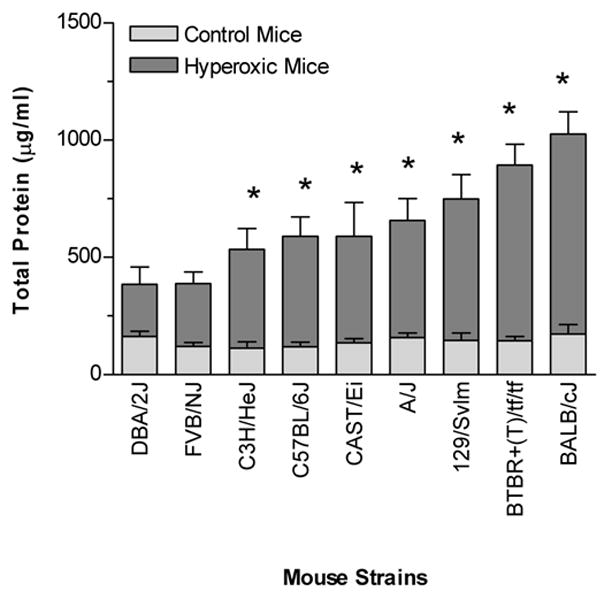
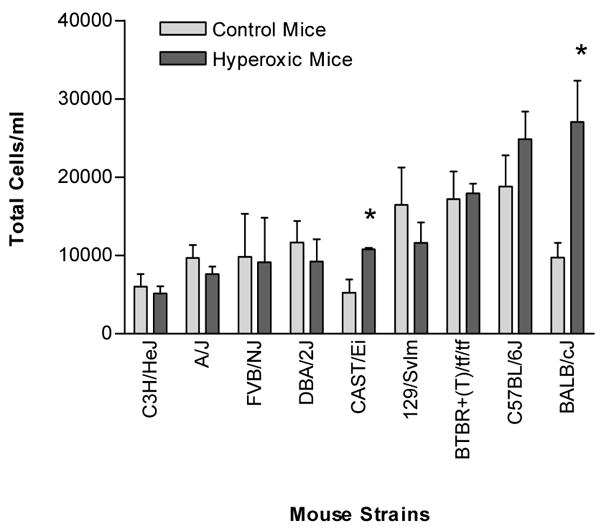
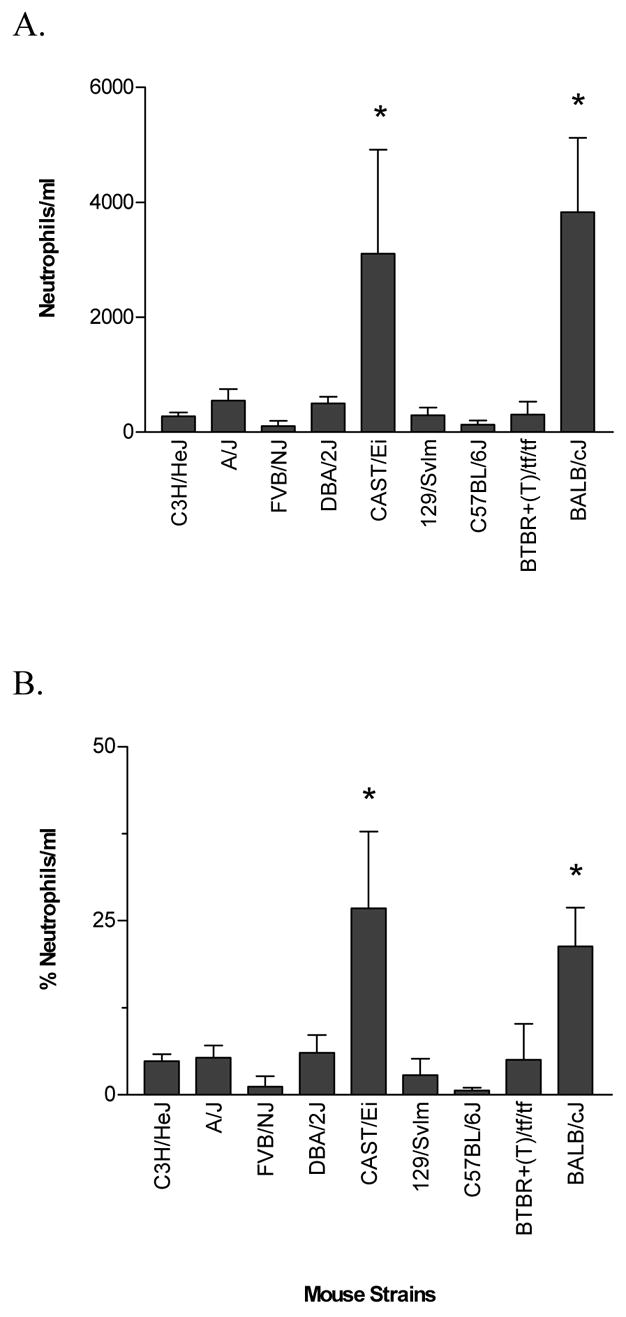
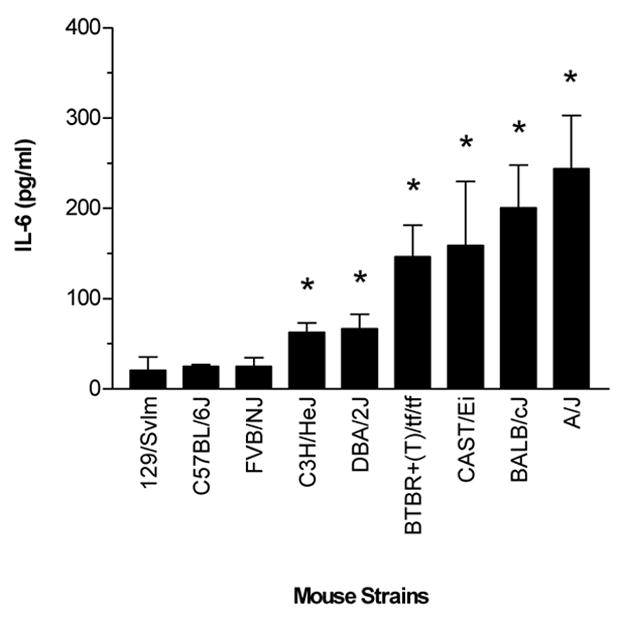
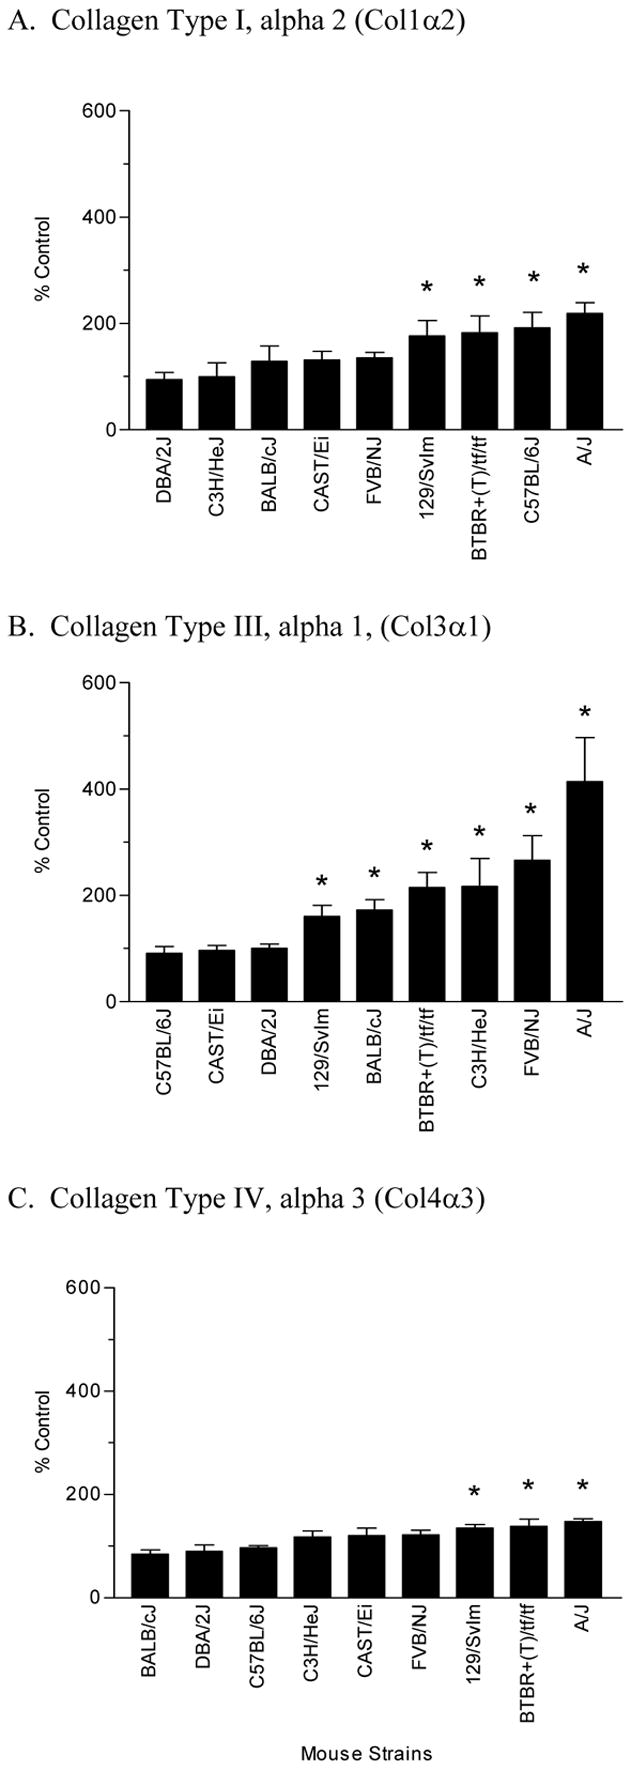
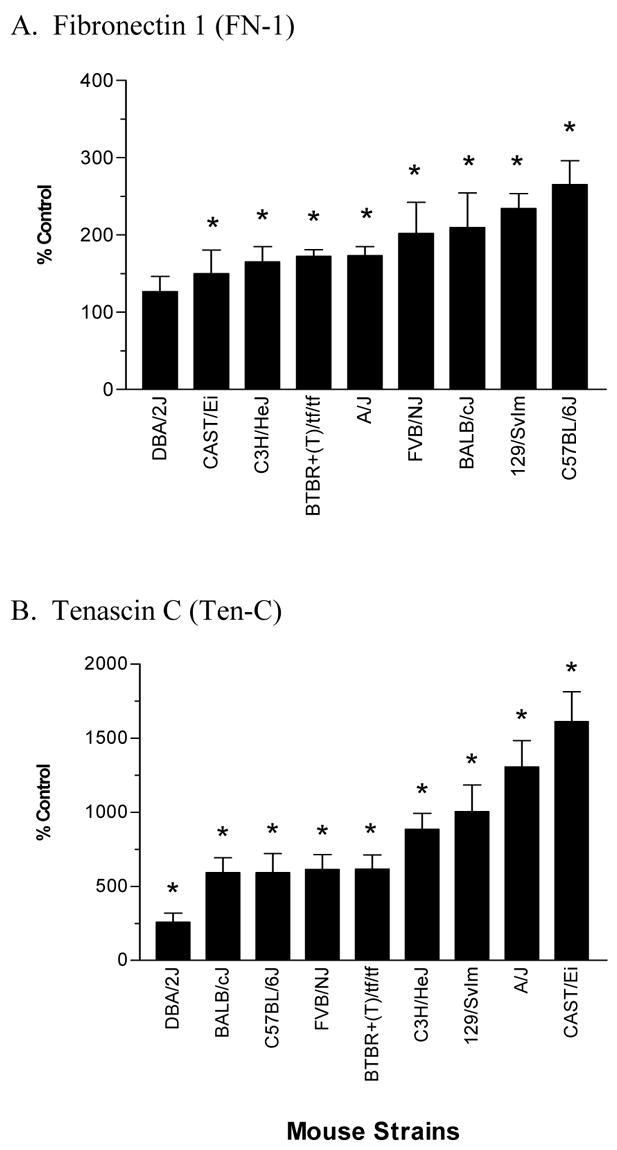
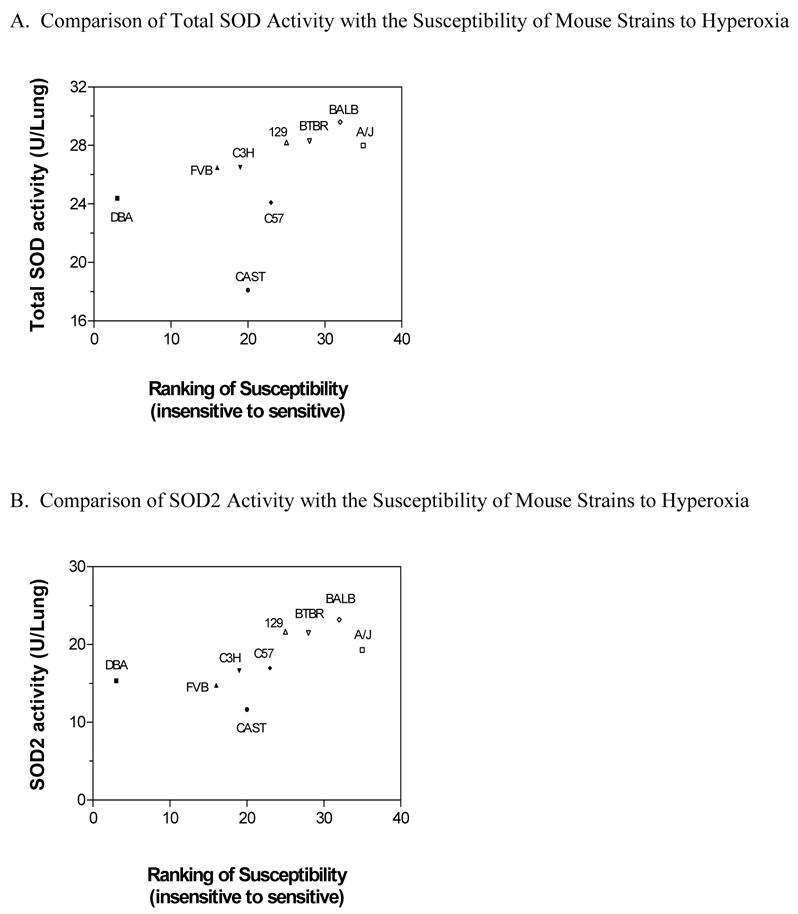
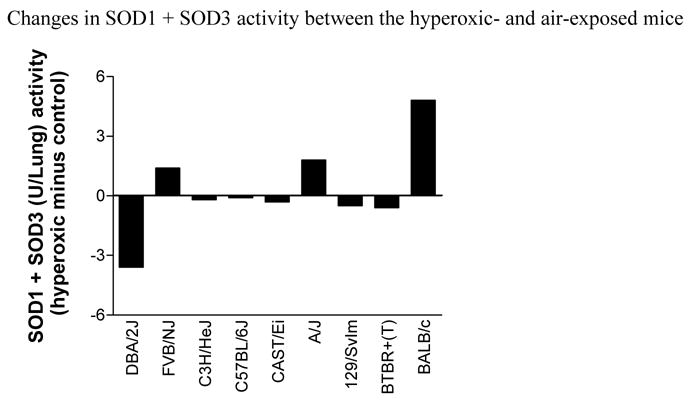
To evaluate the effect of genetic background on oxygen (O2) toxicity, nine genetically diverse mouse strains (129/SvIm, A/J, BALB/cJ, BTBR+(T)/tf/tf, CAST/Ei, C3H/HeJ, C57BL/6J, DBA/2J, and FVB/NJ) were exposed to more than 99% O2 for 72 h. Immediately following the hyperoxic challenge, the mouse strains demonstrated distinct pathophysiologic responses. The BALB/cJ and CAST/Ei strains, which were the only strains to demonstrate mortality from the hyperoxic challenges, were also the only strains to display significant neutrophil infiltration into their lower respiratory tract. In addition, the O2-challenged BALB/cJ and CAST/Ei mice were among six strains (A/J, BALB/cJ, CAST/Ei, BTBR+(T)/tf/tf, DBA/2J, and C3H/HeJ) that had significantly increased interleukin 6 concentrations in the whole lung lavage fluid and were among all but one strain that had large increases in lung permeability compared with air-exposed controls. In contrast, the DBA/2J strain was the only strain not to have any significant alterations in lung permeability following hyperoxic challenge. The expression of the extracellular matrix proteins, including collagens I, III, and IV, fibronectin I, and tenascin C, also varied markedly among the mouse strains, as did the activities of total superoxide dismutase (SOD) and manganese-SOD (Mn-SOD or SOD2). These data suggest that the response to O2 depends, in part, on the genetic background and that some of the strains analyzed can be used to identify specific loci and genes underlying the response to O2.
Figures

Similar articles
-
Ozone-induced acute pulmonary injury in inbred mouse strains.Am J Respir Cell Mol Biol. 2004 Jul;31(1):69-77. doi: 10.1165/rcmb.2003-0001OC. Epub 2004 Feb 19. Am J Respir Cell Mol Biol. 2004. PMID: 14975936
-
Mouse genetic background impacts susceptibility to hyperoxia-driven perturbations to lung maturation.Pediatr Pulmonol. 2019 Jul;54(7):1060-1077. doi: 10.1002/ppul.24304. Epub 2019 Mar 7. Pediatr Pulmonol. 2019. PMID: 30848059
-
Genetic basis of murine antibacterial defense to streptococcal lung infection.Immunogenetics. 2007 Sep;59(9):713-24. doi: 10.1007/s00251-007-0242-6. Epub 2007 Aug 14. Immunogenetics. 2007. PMID: 17701033
-
Allergen-induced airway disease is mouse strain dependent.Am J Physiol Lung Cell Mol Physiol. 2003 Jul;285(1):L32-42. doi: 10.1152/ajplung.00390.2002. Epub 2003 Mar 7. Am J Physiol Lung Cell Mol Physiol. 2003. PMID: 12626335
-
Analysis of Acrolein Exposure Induced Pulmonary Response in Seven Inbred Mouse Strains and Human Primary Bronchial Epithelial Cells Cultured at Air-Liquid Interface.Biomed Res Int. 2020 Oct 8;2020:3259723. doi: 10.1155/2020/3259723. eCollection 2020. Biomed Res Int. 2020. PMID: 33110918 Free PMC article.
Cited by
-
Long-Term Pulmonary Dysfunction by Hyperoxia Exposure during Severe Viral Lower Respiratory Tract Infection in Mice.Pathogens. 2022 Nov 12;11(11):1334. doi: 10.3390/pathogens11111334. Pathogens. 2022. PMID: 36422586 Free PMC article.
-
Critical role of airway macrophages in modulating disease severity during influenza virus infection of mice.J Virol. 2010 Aug;84(15):7569-80. doi: 10.1128/JVI.00291-10. Epub 2010 May 26. J Virol. 2010. PMID: 20504924 Free PMC article.
-
Transcriptomic and epigenetic mechanisms underlying myeloid diversity in the lung.Nat Immunol. 2020 Feb;21(2):221-231. doi: 10.1038/s41590-019-0582-z. Epub 2020 Jan 20. Nat Immunol. 2020. PMID: 31959980 Free PMC article.
-
The triterpenoid CDDO-imidazolide confers potent protection against hyperoxic acute lung injury in mice.Am J Respir Crit Care Med. 2009 Nov 1;180(9):867-74. doi: 10.1164/rccm.200905-0670OC. Epub 2009 Aug 13. Am J Respir Crit Care Med. 2009. PMID: 19679692 Free PMC article.
-
Probucol attenuates hyperoxia-induced lung injury in mice.PLoS One. 2017 Apr 6;12(4):e0175129. doi: 10.1371/journal.pone.0175129. eCollection 2017. PLoS One. 2017. PMID: 28384256 Free PMC article.
References
-
- Adamson IYR, Bowden DH, Wyatt JP. Oxygen poisoning in mice. Ultrastructural and surfactant studies during exposure and recovery. Arch Pathol. 1970;90:463–472. - PubMed
-
- Bureau M, Sourouille P, Brun-Pascaud M, Fey M, Pocidalo JJ. Hyperoxia effects on lung vascular circulating and marginated leukocytes in the rat. Bull Eur Physiopathol Respir. 1985;21:325–9. - PubMed
-
- Capellier G, Maupoil V, Boussat S, Laurent E, Neidhardt A. Oxygen toxicity and tolerance (Review) Minerva Anestesiol. 1999;65:388–92. - PubMed
-
- Cho HY, Jedlicka AE, Reddy SP, Zhang LY, Kensler TW, Kleeberger SR. Linkage analysis of susceptibility to hyperoxia: Nrf2 is a candidate gene. Am J Respir Cell Mol Biol. 2002;26:42–51. - PubMed
Publication types
MeSH terms
Substances
Grants and funding
- NIH0012222857/ImNIH/Intramural NIH HHS/United States
- HL66604/HL/NHLBI NIH HHS/United States
- ES11375/ES/NIEHS NIH HHS/United States
- U19 ES011375/ES/NIEHS NIH HHS/United States
- R01 HL062641/HL/NHLBI NIH HHS/United States
- HL66611/HL/NHLBI NIH HHS/United States
- ES07498/ES/NIEHS NIH HHS/United States
- P30 ES011961/ES/NIEHS NIH HHS/United States
- Z99 ES999999/ImNIH/Intramural NIH HHS/United States
- ES012496/ES/NIEHS NIH HHS/United States
- P01 ES012496/ES/NIEHS NIH HHS/United States
- ES09607/ES/NIEHS NIH HHS/United States
- ES11961/ES/NIEHS NIH HHS/United States
- R01 ES007498/ES/NIEHS NIH HHS/United States
- U01 HL066611/HL/NHLBI NIH HHS/United States
- U19 ES012496/ES/NIEHS NIH HHS/United States
LinkOut - more resources
Full Text Sources
Medical
Miscellaneous
