. 2006 Sep 22;2(9):e127.
doi: 10.1371/journal.pcbi.0020127. Epub 2006 Aug 3.

Computational model of vascular endothelial growth factor spatial distribution in muscle and pro-angiogenic cell therapy

Affiliations

Computational model of vascular endothelial growth factor spatial distribution in muscle and pro-angiogenic cell therapy

Feilim Mac Gabhann et al. PLoS Comput Biol. .

Abstract

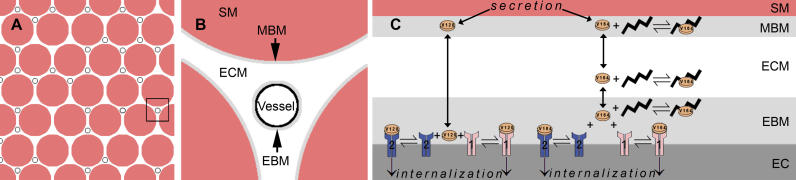
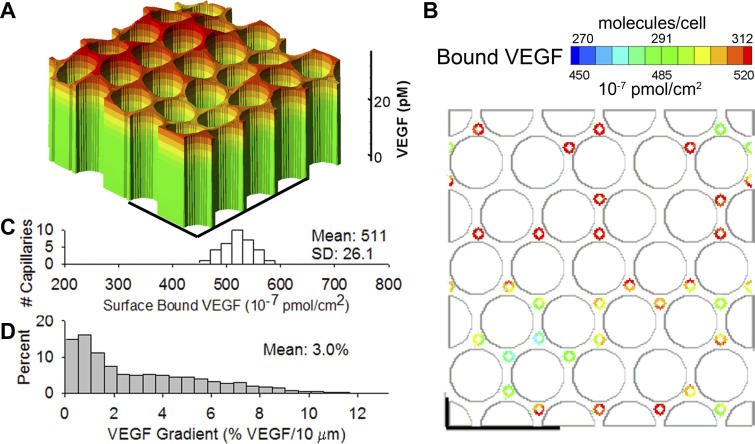
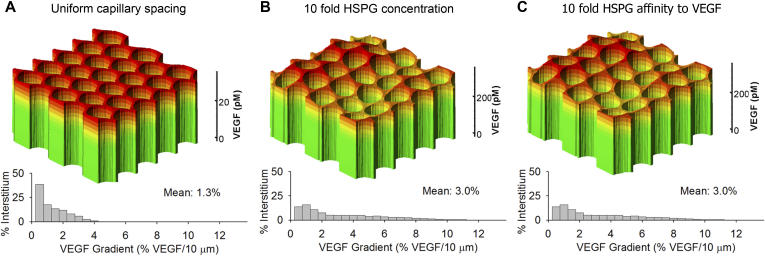
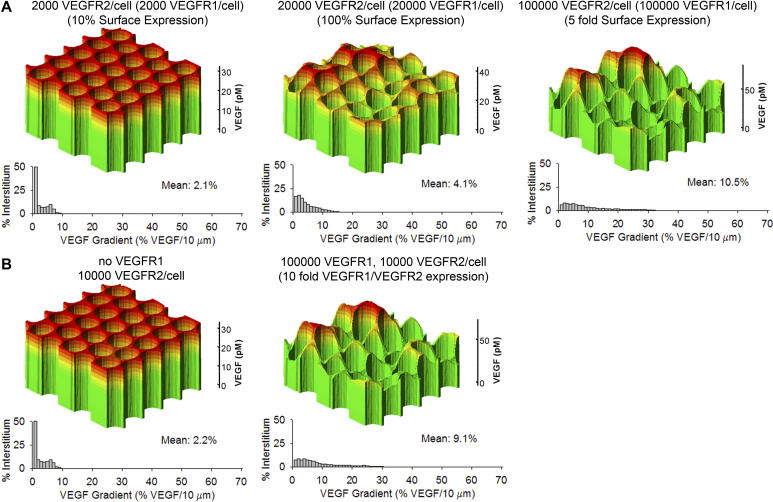
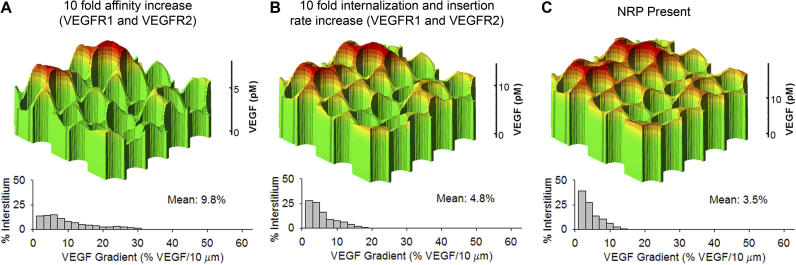
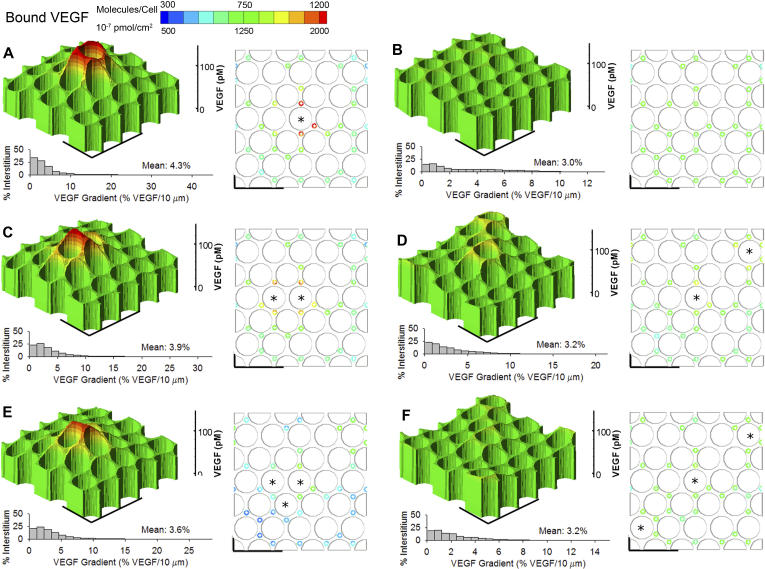
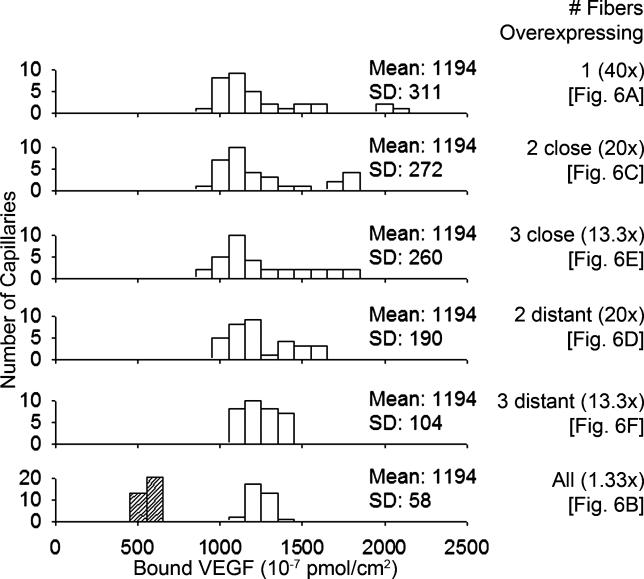
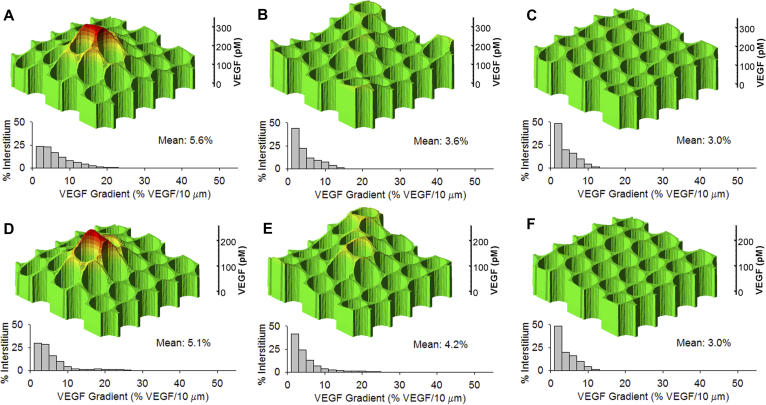
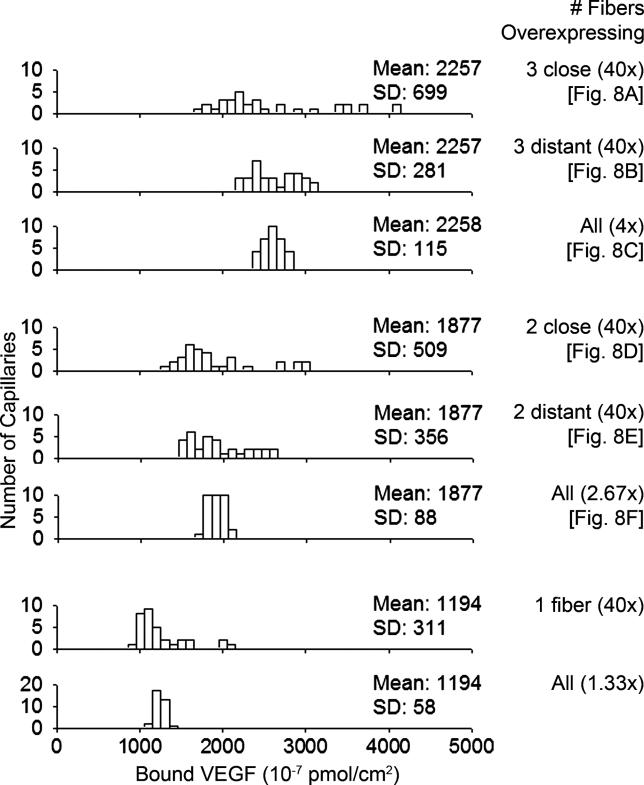
Members of the vascular endothelial growth factor (VEGF) family of proteins are critical regulators of angiogenesis. VEGF concentration gradients are important for activation and chemotactic guidance of capillary sprouting, but measurement of these gradients in vivo is not currently possible. We have constructed a biophysically and molecularly detailed computational model to study microenvironmental transport of two isoforms of VEGF in rat extensor digitorum longus skeletal muscle under in vivo conditions. Using parameters based on experimental measurements, the model includes: VEGF secretion from muscle fibers; binding to the extracellular matrix; binding to and activation of endothelial cell surface VEGF receptors; and internalization. For 2-D cross sections of tissue, we analyzed predicted VEGF distributions, gradients, and receptor binding. Significant VEGF gradients (up to 12% change in VEGF concentration over 10 mum) were predicted in resting skeletal muscle with uniform VEGF secretion, due to non-uniform capillary distribution. These relative VEGF gradients were not sensitive to extracellular matrix composition, or to the overall VEGF expression level, but were dependent on VEGF receptor density and affinity, and internalization rate parameters. VEGF upregulation in a subset of fibers increased VEGF gradients, simulating transplantation of pro-angiogenic myoblasts, a possible therapy for ischemic diseases. The number and relative position of overexpressing fibers determined the VEGF gradients and distribution of VEGF receptor activation. With total VEGF expression level in the tissue unchanged, concentrating overexpression into a small number of adjacent fibers can increase the number of capillaries activated. The VEGF concentration gradients predicted for resting muscle (average 3% VEGF/10 mum) is sufficient for cellular sensing; the tip cell of a vessel sprout is approximately 50 mum long. The VEGF gradients also result in heterogeneity in the activation of blood vessel VEGF receptors. This first model of VEGF tissue transport and heterogeneity provides a platform for the design and evaluation of therapeutic approaches.


Conflict of interest statement

Competing interests. The authors have declared that no competing interests exist.

Figures

Figure 1
Figure 1. Schematics of VEGF Transport in Skeletal Muscle
(A) Cross-sectional view of EDL tissue: red-filled circles represent muscle fibers, black unfilled circles represent capillaries located in the interstitium of the tissue. The fibers are assumed to be regularly spaced and hexagonally packed. (B) Interstitial space near a capillary: muscle fibers are surrounded by a thin MBM; capillaries formed by endothelial cells are surrounded by an EBM. The ECM lies in between the EBM and MBM, and VEGF diffuses throughout the interstitial space. (C) Diffusion and binding: two VEGF isoforms are secreted from the skeletal muscle myocyte into the MBM: VEGF120 and VEGF164 diffuse through the MBM, EBM, and ECM, but only VEGF164 is able to bind with HSPG in each layer. Near the endothelial cell surface (located in the EBM), VEGF can interact with VEGFR1 and VEGFR2, and both can be internalized whether bound to VEGF or unbound.
Figure 2
Figure 2. VEGF Distribution in Resting Skeletal Muscle for Uniform Secretion of VEGF
(A) VEGF concentration variations in skeletal muscle. The surface represents the total VEGF concentration (free plus HSPG-bound) across the interstitial space. (B) Graphical representation of VEGF binding: large gray circles represent muscle fibers. Small circles represent capillaries and are color-coded to show the amount of VEGF bound to the surface of the capillary. (C) Histogram of average VEGF binding to capillaries. Each capillary has a different amount of bound VEGF due to the spatial variations of VEGF. Some capillaries may be activated while others are not. (D) Histogram of VEGF gradients. The percentage of tissue that experiences VEGF gradient of a certain magnitude. Gradient is defined as the change in VEGF concentration over 10 μm divided by the mean VEGF concentration in the tissue. Capillary distribution in subsequent figures (except Figure 3A) is the same as Figure 2.
Figure 3
Figure 3. Effect of VEGF Capillary Distribution and HSPG on VEGF Gradients
(A) Uniform capillary distribution results in a decrease in the average VEGF gradients in the tissue. (B,C) VEGF gradients at steady state are invariant (in percentage terms) to changes in the extracellular matrix composition. Increased density or affinity of VEGF binding sites results in increased bound VEGF content (and thus increased absolute values of the gradient), but no change in the relative gradient.
Figure 4
Figure 4. VEGF Receptor Density Alters Magnitude of VEGF Gradients
Increasing VEGFR2 density (A) and increasing VEGFR1 density (B) increase the gradients of VEGF concentration in tissue. Surfaces represent concentration of total VEGF (pM, free plus HSPG-bound) in the ECM across the cross section of tissue. Histograms of VEGF gradients and the percentage of tissue involved. Gradient defined as in Figure 2.
Figure 5
Figure 5. Effect of VEGF Receptor Kinetics on VEGF Gradients
(A) Increased binding affinity (increased on-rate) has a similar outcome to increases in the receptor density: the VEGF gradients are magnified. (B) Increased internalization rate of VEGF-receptor complexes results in an increase in the VEGF gradients.
Figure 6
Figure 6. Cell-Based Delivery of VEGF to Muscle
The total VEGF expression in each of the tissues (A–F) is the same; the arrangement delivery of VEGF from cells incorporated into each tissue is different. Stars mark the fiber(s) that overexpress VEGF. VEGF gradients and capillary activation graphs are as for Figure 2. (A) 40-Fold overexpression of VEGF in one fiber. (B) Uniform 1.33-fold overexpression of VEGF by all fibers. (C,D) 20-Fold overexpression of VEGF in two fibers, close together (C) or distant (D). (E,F) 13.3-Fold overexpression of VEGF in three fibers, close together (E) or distant (F).
Figure 7
Figure 7. VEGF Binding to Capillaries for Cell-Based Delivery of VEGF to Muscle
Each vessel in each tissue experiences a different level of VEGF binding. Total VEGF expression level is the same in each tissue, and the mean VEGF binding to capillaries is the same, but the concentrating of VEGF overexpression into a small number of adjacent fibers results in increased variability of binding. The tissues are arranged in decreasing order of standard deviation of VEGF-capillary binding, as a metric of the variability in capillary activation within the tissue. The more concentrated the VEGF overexpression, the higher the variability. Each tissue is labeled with the number of fibers overexpressing VEGF, the level of overexpression in each fiber, and the panel in Figure 6 for the corresponding VEGF concentration and receptor activation. The shaded bars in the bottom graph represent VEGF binding to capillaries under basal (no overexpression) conditions.
Figure 8
Figure 8. Increasing Dose of Cell-Based VEGF Delivery
The delivery of two or three fibers overexpressing VEGF 40-fold is compared with an equivalent uniform overexpression. (A,B) VEGF concentration and gradients for three 40-fold overexpressing fibers close together (A) or distant (B). (C) Uniform VEGF overexpression of 4-fold. (D,E) VEGF concentration and gradients for two 40-fold overexpressing fibers close together (D) or distant (E). (F) Uniform VEGF overexpression of 2.67-fold.
Figure 9
Figure 9. VEGF Binding to Capillaries for Increasing VEGF Dose
The distribution of VEGF binding on vessels for one, two, and three 40-fold overexpressing fibers, and the equivalent uniform overexpression. Each tissue is labeled with the number of fibers overexpressing VEGF, the level of overexpression in each fiber, and the panel in Figure 8 for the corresponding VEGF concentration and receptor activation.

References

    1. Matsumoto T, Claesson-Welsh L. VEGF receptor signal transduction. Sci STKE. 2001;2001:RE21. - PubMed
    1. Ng YS, Rohan R, Sunday ME, Demello DE, D'Amore PA. Differential expression of VEGF isoforms in mouse during development and in the adult. Dev Dyn. 2001;220:112–121. - PubMed
    1. Zhang QX, Magovern CJ, Mack CA, Budenbender KT, Ko W, et al. Vascular endothelial growth factor is the major angiogenic factor in omentum: Mechanism of the omentum-mediated angiogenesis. J Surg Res. 1997;67:147–154. - PubMed
    1. Maharaj AS, Saint-Geniez M, Maldonado AE, D'Amore PA. Vascular endothelial growth factor localization in the adult. Am J Pathol. 2006;168:639–648. - PMC - PubMed
    1. Ren Y, Law S, Huang X, Lee PY, Bacher M, et al. Macrophage migration inhibitory factor stimulates angiogenic factor expression and correlates with differentiation and lymph node status in patients with esophageal squamous cell carcinoma. Ann Surg. 2005;242:55–63. - PMC - PubMed

Publication types

MeSH terms

Substances