

Genomic analysis of the hierarchical structure of regulatory networks
- PMID: 17003135
- PMCID: PMC1595419
- DOI: 10.1073/pnas.0508637103
Genomic analysis of the hierarchical structure of regulatory networks
Abstract
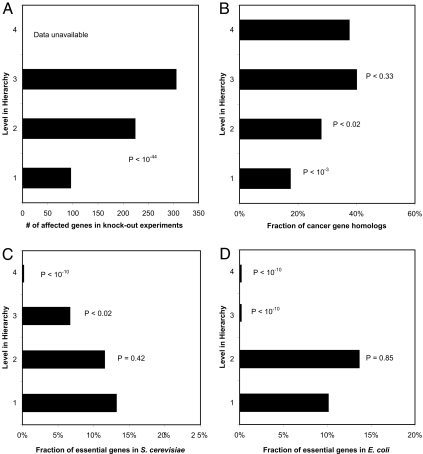
A fundamental question in biology is how the cell uses transcription factors (TFs) to coordinate the expression of thousands of genes in response to various stimuli. The relationships between TFs and their target genes can be modeled in terms of directed regulatory networks. These relationships, in turn, can be readily compared with commonplace "chain-of-command" structures in social networks, which have characteristic hierarchical layouts. Here, we develop algorithms for identifying generalized hierarchies (allowing for various loop structures) and use these approaches to illuminate extensive pyramid-shaped hierarchical structures existing in the regulatory networks of representative prokaryotes (Escherichia coli) and eukaryotes (Saccharomyces cerevisiae), with most TFs at the bottom levels and only a few master TFs on top. These masters are situated near the center of the protein-protein interaction network, a different type of network from the regulatory one, and they receive most of the input for the whole regulatory hierarchy through protein interactions. Moreover, they have maximal influence over other genes, in terms of affecting expression-level changes. Surprisingly, however, TFs at the bottom of the regulatory hierarchy are more essential to the viability of the cell. Finally, one might think master TFs achieve their wide influence through directly regulating many targets, but TFs with most direct targets are in the middle of the hierarchy. We find, in fact, that these midlevel TFs are "control bottlenecks" in the hierarchy, and this great degree of control for "middle managers" has parallels in efficient social structures in various corporate and governmental settings.
Conflict of interest statement
Conflict of interest statement: No conflicts declared.
Figures


Similar articles
-
Controllability analysis of transcriptional regulatory networks reveals circular control patterns among transcription factors.Integr Biol (Camb). 2015 May;7(5):560-8. doi: 10.1039/c4ib00247d. Epub 2015 Apr 9. Integr Biol (Camb). 2015. PMID: 25855217
-
Reconciling gene expression data with known genome-scale regulatory network structures.Genome Res. 2003 Nov;13(11):2423-34. doi: 10.1101/gr.1330003. Epub 2003 Oct 14. Genome Res. 2003. PMID: 14559784 Free PMC article.
-
Improved recovery of cell-cycle gene expression in Saccharomyces cerevisiae from regulatory interactions in multiple omics data.BMC Genomics. 2020 Feb 13;21(1):159. doi: 10.1186/s12864-020-6554-8. BMC Genomics. 2020. PMID: 32054475 Free PMC article.
-
Chromosomal organization is shaped by the transcription regulatory network.Trends Genet. 2005 Mar;21(3):138-42. doi: 10.1016/j.tig.2005.01.003. Trends Genet. 2005. PMID: 15734572 Review.
-
Genome-wide analysis of the context-dependence of regulatory networks.Genome Biol. 2005;6(2):206. doi: 10.1186/gb-2005-6-2-206. Epub 2005 Jan 27. Genome Biol. 2005. PMID: 15693953 Free PMC article. Review.
Cited by
-
Inherent directionality explains the lack of feedback loops in empirical networks.Sci Rep. 2014 Dec 22;4:7497. doi: 10.1038/srep07497. Sci Rep. 2014. PMID: 25531727 Free PMC article.
-
Grand Challenges for Artificial Intelligence in Molecular Medicine.Front Mol Med. 2021 Jul 22;1:734659. doi: 10.3389/fmmed.2021.734659. eCollection 2021. Front Mol Med. 2021. PMID: 39087080 Free PMC article. No abstract available.
-
iHerd: an integrative hierarchical graph representation learning framework to quantify network changes and prioritize risk genes in disease.PLoS Comput Biol. 2023 Sep 11;19(9):e1011444. doi: 10.1371/journal.pcbi.1011444. eCollection 2023 Sep. PLoS Comput Biol. 2023. PMID: 37695793 Free PMC article.
-
Regulation of transcription in plants: mechanisms controlling developmental switches.Nat Rev Genet. 2010 Dec;11(12):830-42. doi: 10.1038/nrg2885. Epub 2010 Nov 10. Nat Rev Genet. 2010. PMID: 21063441 Review.
-
Flux-based hierarchical organization of Escherichia coli's metabolic network.PLoS Comput Biol. 2020 Apr 20;16(4):e1007832. doi: 10.1371/journal.pcbi.1007832. eCollection 2020 Apr. PLoS Comput Biol. 2020. PMID: 32310959 Free PMC article.
References
-
- Lee TI, Rinaldi NJ, Robert F, Odom DT, Bar-Joseph Z, Gerber GK, Hannett NM, Harbison CT, Thompson CM, Simon I, et al. Science. 2002;298:799–804. - PubMed
-
- Jeong H, Mason SP, Barabasi AL, Oltvai ZN. Nature. 2001;411:41–42. - PubMed
-
- Qian J, Dolled-Filhart M, Lin J, Yu H, Gerstein M. J Mol Biol. 2001;314:1053–1066. - PubMed
-
- Albert R, Barabasi AL. Rev Mod Phys. 2002;74:47–97.
Publication types
MeSH terms
Substances
LinkOut - more resources
Full Text Sources
Other Literature Sources
Molecular Biology Databases
