

ERK, p38, and Smad signaling pathways differentially regulate transforming growth factor-beta1 autoinduction in proximal tubular epithelial cells
- PMID: 17003485
- PMCID: PMC1698849
- DOI: 10.2353/ajpath.2006.050921
ERK, p38, and Smad signaling pathways differentially regulate transforming growth factor-beta1 autoinduction in proximal tubular epithelial cells
Abstract
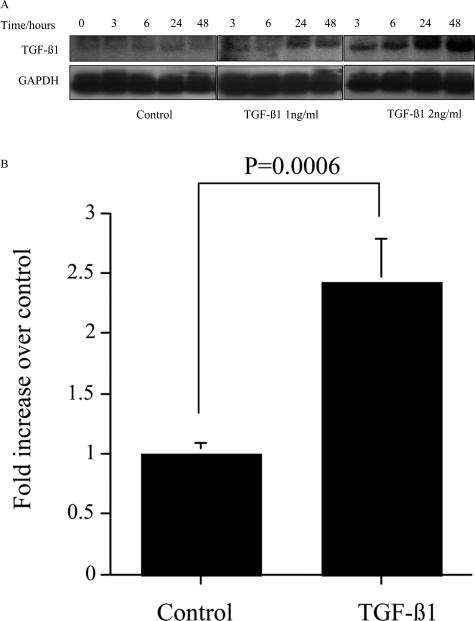
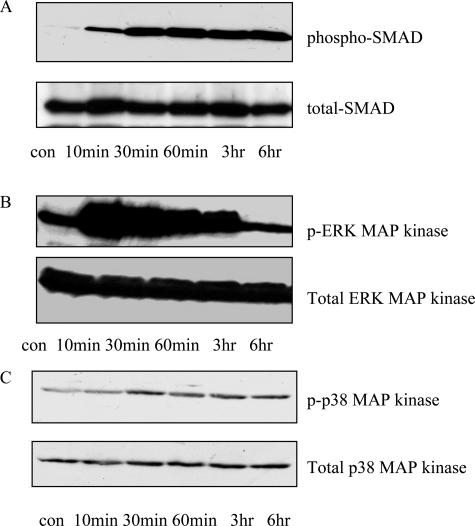
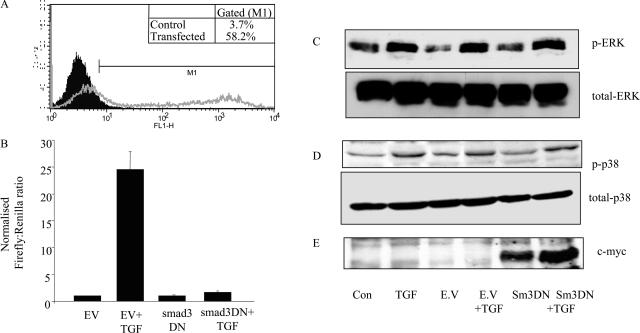
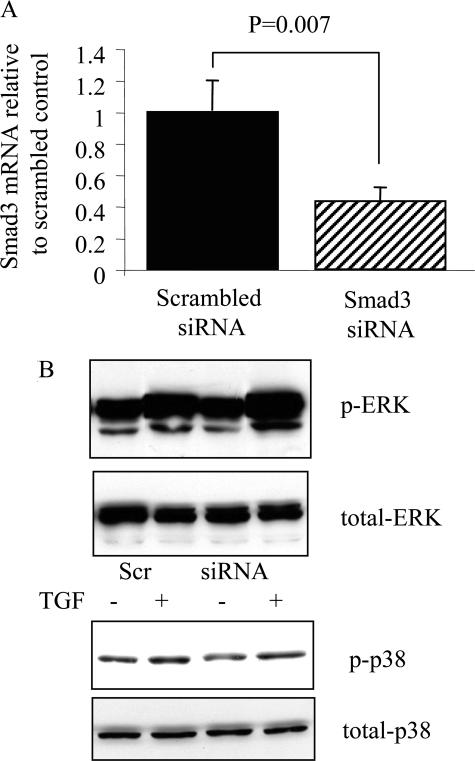
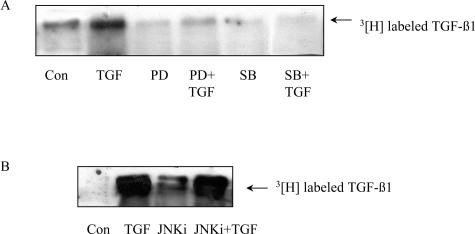
Transforming growth factor (TGF)-beta1 is a mediator of the final common pathway of fibrosis associated with progressive renal disease, a process in which proximal tubular cells (PTCs) are known to play an important part. The aim of the current study was to examine the mechanism of PTC TGF-beta1 autoinduction. The addition of TGF-beta1 led to increased amounts of TGF-beta1 mRNA and increased de novo protein synthesis. The addition of TGF-beta1 led to increased phosphorylation of R-Smads and activation of extracellular signal-regulated kinase mitogen-activated protein (MAP) kinase and p38 MAP kinase pathways. Use of a dominant-negative Smad3 (Smad3 DN) expression vector, Smad3 small interfering RNA, and inhibition of extracellular signal-regulated kinase and p38 MAP kinase pathways with the chemical inhibitors PD98059 or SB203580 suggested that activation of these signaling pathways occurred independently. Smad3 DN expression, Smad3 small interfering RNA, or the addition of PD98059 inhibited TGF-beta1-dependent stimulation of TGF-beta1 mRNA. Furthermore, Smad3 blockade specifically inhibited activation of the transcription factor AP-1 by TGF-beta1, whereas PD98059 prevented TGF-beta1-dependent nuclear factor-kappaB activation. In contrast inhibition of p38 MAP kinase inhibited de novo TGF-beta1 protein synthesis but did not influence TGF-beta1 mRNA expression or activation of either transcription factor. In summary, in PTCs, TGF-beta1 autoinduction requires the coordinated action of independently regulated Smad and non-Smad pathways. Furthermore these pathways regulate distinct transcriptional and translational components of TGF-beta1 synthesis.
Figures


Similar articles
-
Inhibition of KCa3.1 suppresses TGF-β1 induced MCP-1 expression in human proximal tubular cells through Smad3, p38 and ERK1/2 signaling pathways.Int J Biochem Cell Biol. 2014 Feb;47:1-10. doi: 10.1016/j.biocel.2013.11.017. Epub 2013 Nov 28. Int J Biochem Cell Biol. 2014. PMID: 24291552
-
Transforming growth factor-beta-induced alpha-smooth muscle cell actin expression in renal proximal tubular cells is regulated by p38beta mitogen-activated protein kinase, extracellular signal-regulated protein kinase1,2 and the Smad signalling during epithelial-myofibroblast transdifferentiation.Nephrol Dial Transplant. 2008 May;23(5):1537-45. doi: 10.1093/ndt/gfm789. Epub 2008 Jan 11. Nephrol Dial Transplant. 2008. PMID: 18192325
-
Indoxyl sulfate enhances p53-TGF-β1-Smad3 pathway in proximal tubular cells.Am J Nephrol. 2013;37(2):97-103. doi: 10.1159/000346420. Epub 2013 Jan 25. Am J Nephrol. 2013. PMID: 23363842
-
Role of extracellular signal-regulated kinase, p38 kinase, and activator protein-1 in transforming growth factor-beta1-induced alpha smooth muscle actin expression in human fetal lung fibroblasts in vitro.Lung. 2006 Jan-Feb;184(1):33-42. doi: 10.1007/s00408-005-2560-5. Lung. 2006. PMID: 16598650
-
Role of reactive oxygen species in TGF-beta1-induced mitogen-activated protein kinase activation and epithelial-mesenchymal transition in renal tubular epithelial cells.J Am Soc Nephrol. 2005 Mar;16(3):667-75. doi: 10.1681/ASN.2004050425. Epub 2005 Jan 26. J Am Soc Nephrol. 2005. PMID: 15677311
Cited by
-
RIPK3: A New Player in Renal Fibrosis.Front Cell Dev Biol. 2020 Jun 16;8:502. doi: 10.3389/fcell.2020.00502. eCollection 2020. Front Cell Dev Biol. 2020. PMID: 32613000 Free PMC article. Review.
-
TGF-β regulates phosphorylation and stabilization of Sox9 protein in chondrocytes through p38 and Smad dependent mechanisms.Sci Rep. 2016 Dec 8;6:38616. doi: 10.1038/srep38616. Sci Rep. 2016. PMID: 27929080 Free PMC article.
-
Insulin-like growth factor binding protein-related protein 1 (IGFBPrP1) contributes to liver inflammation and fibrosis via activation of the ERK1/2 pathway.Hepatol Int. 2015 Jan;9(1):130-41. doi: 10.1007/s12072-014-9578-9. Epub 2014 Sep 19. Hepatol Int. 2015. PMID: 25788387
-
Erk in kidney diseases.J Signal Transduct. 2011;2011:768512. doi: 10.1155/2011/768512. Epub 2011 Apr 7. J Signal Transduct. 2011. PMID: 21776388 Free PMC article.
-
BMP6 reverses TGF-beta1-induced changes in HK-2 cells: implications for the treatment of renal fibrosis.Acta Pharmacol Sin. 2009 Jul;30(7):994-1000. doi: 10.1038/aps.2009.56. Epub 2009 Jun 22. Acta Pharmacol Sin. 2009. PMID: 19543302 Free PMC article.
References
-
- Eddy AA. Molecular insights into renal interstitial fibrosis. J Am Soc Nephrol. 1996;7:2495–2508. - PubMed
-
- Remuzzi G, Ruggeneti P, Benignin A. Understanding the nature of renal disease progression. Kidney Int. 1997;51:2–15. - PubMed
-
- Bader R, Bader H, Grund KE, Mackensen-Haen S, Christ H, Bohle A. Structure and function of the kidney in diabetic glomerulosclerosis: correlations between morphological and functional parameters. Pathol Res Pract. 1980;167:204–216. - PubMed
-
- Bohle A, Mackensen-Haen S, Gise H. Significance of tubulointerstitial changes in the renal cortex for the excretory function and concentration ability of the kidney: a morphometric contribution. Am J Nephrol. 1987;6:421–433. - PubMed
-
- Wehrmann M, Bohle A, Bogenschutz O, Eissele R, Freislederer A, Ohlschlegel C, Schumm G, Batz C, Gartner HV. Long-term prognosis of chronic idiopathic membranous glomerulonephritis. An analysis of 334 cases with particular regard to tubulo-interstitial changes. Clin Nephrol. 1989;31:67–76. - PubMed
Publication types
MeSH terms
Substances
LinkOut - more resources
Full Text Sources
Miscellaneous
