. 2006 Oct;169(4):1415-26.
doi: 10.2353/ajpath.2006.060324.

Hyaluronidase expression induces prostate tumor metastasis in an orthotopic mouse model

Affiliations

Hyaluronidase expression induces prostate tumor metastasis in an orthotopic mouse model

Joy L Kovar et al. Am J Pathol. 2006 Oct.

Abstract

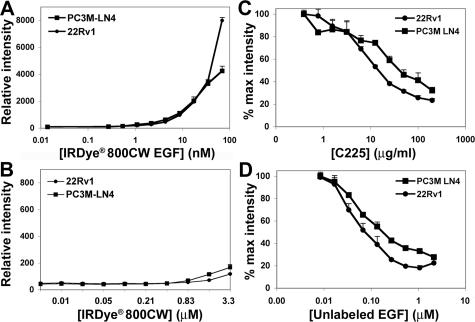
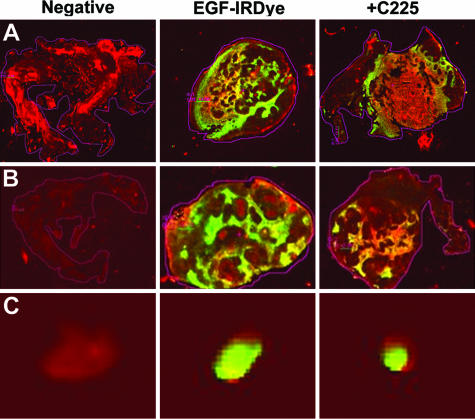
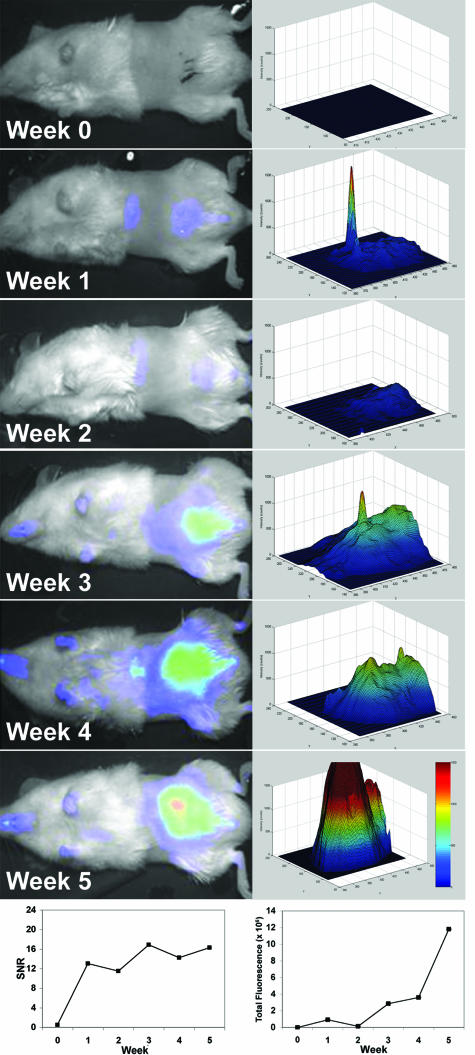
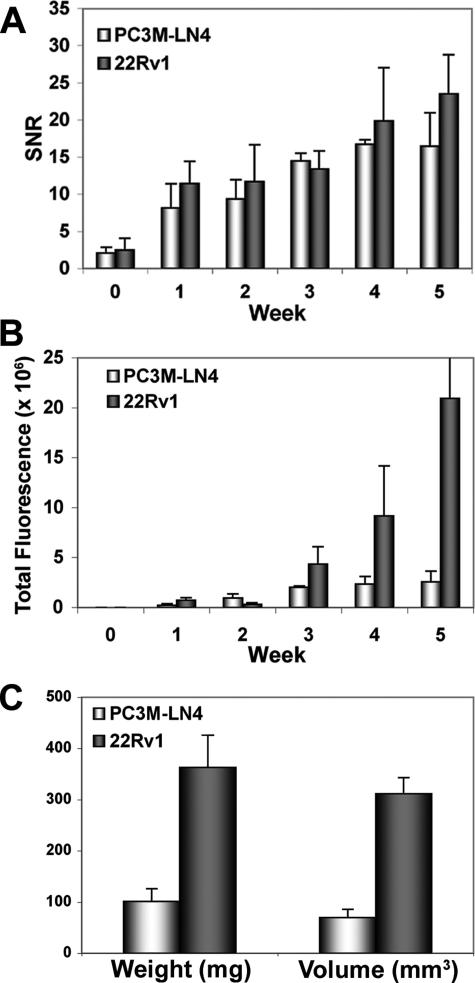
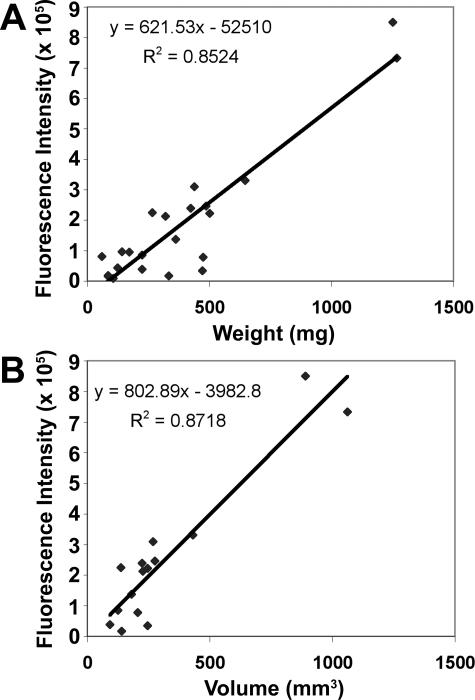
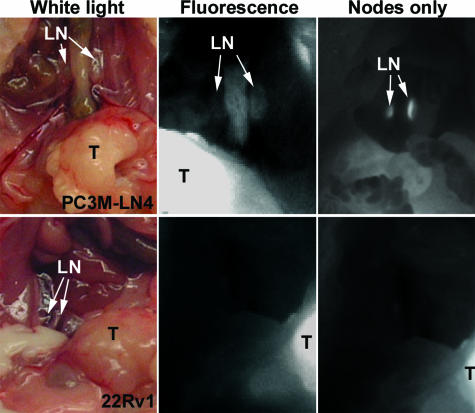
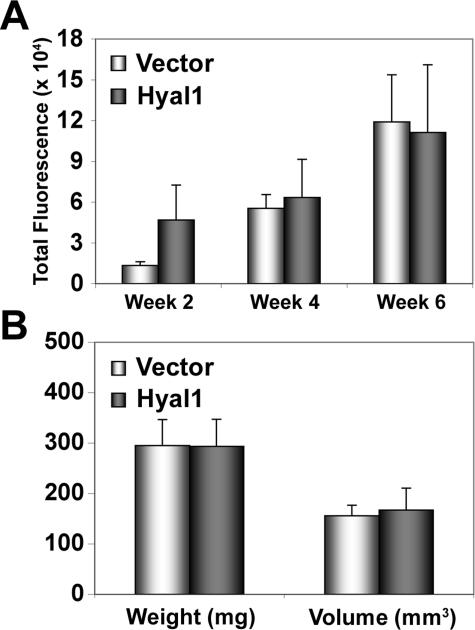
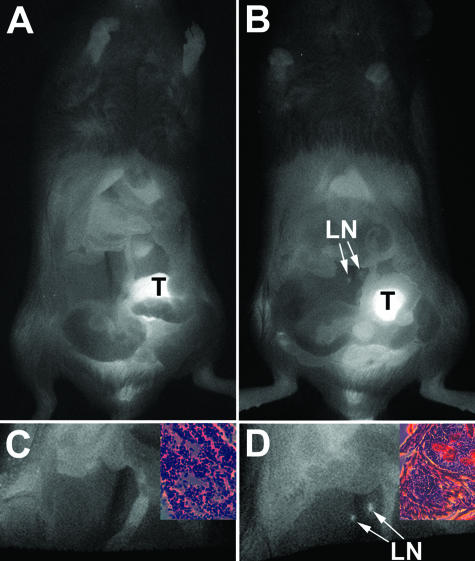
Molecular mechanisms of prostate cancer progression are frequently studied in mice by orthotopic injection of aggressive cell lines, which yield primary tumors that spontaneously metastasize to lymph nodes. In this report, we characterized the human prostate carcinoma cell line 22Rv1 in an orthotopic system and evaluated the functional relevance of the hyaluronidase Hyal1, a correlate of invasive human prostate cancer, to progression in this model. To provide real-time insights into these processes, we first validated use of an epidermal growth factor-conjugated fluorophore to illuminate orthotopic prostate tumors and their metastases in whole animal imaging. Animals receiving intraprostatic injections were tracked throughout a 6-week period. Tumor sizes were correlated 92% with total fluorescence intensities of 22 prostate tumors. In contrast to the highly tumorigenic and metastatic PC3M-LN4 cells, the 22Rv1 line was orthotopically tumorigenic but not metastatic, despite larger tumor sizes. Lymph node metastasis was successfully imaged in animals with PC3M-LN4 tumors on endpoint dissection. Stable transfection of 22Rv1 cells with Hyal1 did not alter growth kinetics of primary orthotopic tumors, but all animals implanted with Hyal1 transfectants exhibited tumor-positive para-aortic lymph nodes. Hyal1 is implicated as an inducer of prostate cancer metastatic progression.


Figures

FIGURE 1
FIGURE 1
In vitro specificity of IRDye 800CW EGF for tumor cell lines. PC3M-LN4 and 22Rv1 human prostate tumor cell lines were cultured to 90% confluence in 96-well plates. Cells were incubated with increasing concentrations of IRDye 800CW EGF (A) or unconjugated, nonreactive IRDye 800CW (B) for 2 minutes and then washed, fixed, permeabilized, and stained with TO-PRO-3. Plates were scanned on Aerius. The 800-nm signal, normalized to the 700-nm control, is plotted as the mean ± SD of three replicate wells. To demonstrate fluorescence specificity, cells were incubated with 70 nmol/L IRDye 800CW EGF in the presence of increasing concentrations of either C225 blocking antibody (C) or unlabeled EGF (D).
FIGURE 2
FIGURE 2
In vivo specificity of EGF receptor targeting. Male NOD/SCID mice with subcutaneous or orthotopic tumors were injected intravenously with vehicle (negative), IRDye 800CW EGF, or with C225 blocking mAb (2 mg i.v.) followed in 1 hour by IRDye 800CW EGF. At 96 hours after injection, subcutaneous (A) and prostatic (B) tumors or lymph nodes (C) excised from the in vivo specificity challenge animals were snap-frozen and cryosectioned for NIR analysis on Odyssey. Tissue autofluorescence is detected in the 700-nm channel and shown in red. Fluorescence of the IRDye 800CW conjugate is detected in the 800-nm channel and shown in green. All images are merged. Differences in fluorescence intensity per unit area, normalized to the vehicle control, were quantified as given in Table 1 and discussed in the text. Fluorescence intensity per unit area was quantified to confirm tumor penetration by the targeting agent and degree of targeting specificity as shown in Table 1.
FIGURE 3
FIGURE 3
Longitudinal growth kinetics and statistical identification of intraprostatic tumors. Male NOD/SCID mice were injected orthotopically with PC3M-LN4 or 22Rv1 tumor cells. At day 3 after implantation of cells, animals were imaged (week 0), injected intravenously with IRDye 800CW EGF (1 nmol), and imaged again 96 hours later (week 1). To track the progress of the tumors longitudinally, mice were reinjected weekly with 1 nmol of probe and imaged 96 hours later. The left column shows the progression of a representative 22Rv1 tumor in color-enhanced fluorescence images superimposed on the white light images. SNR plotted for this animal throughout the time course of the study are shown in the bottom left. In the column on the right, total fluorescence in an ROI encompassing the tumor was quantified for each weekly image by plotting the signal intensity relative to unit area as determined using the SNR cutoff. Fluorescence intensity is color enhanced to assist visualization of differences in signal. Total fluorescence in the ROI is plotted in the lower right as a semiquantitative measure of tumor size.
FIGURE 4
FIGURE 4
Imaging and endpoint parameter comparison of PC3M-LN4 and 22Rv1 tumors. Male NOD/SCID mice bearing orthotopic PC3M-LN4 (n = 4) or 22Rv1 (n = 4) tumors were imaged weekly, and images were analyzed as described for the representative animal in Figure 3. A: SNR ± SEM for all tumors in the study is plotted by tumor type. B: Using the SNR to determine areas of the tumors by signal cutoff, total fluorescence ± SEM was plotted for all eight tumors. C: At the study endpoint, tumors were harvested, weighed, and measured in three dimensions with digital calipers. Mean weight or volume ± SEM is plotted for each group. In all graphs, white bars represent results from PC3M-LN4 tumors and dark bars are 22Rv1.
FIGURE 5
FIGURE 5
Correlation of optical imaging parameters with endpoint tumor size. Excised orthotopic prostate tumors of varying sizes from a total of 22 animals were weighed and measured with standard digital calipers to determine volume. Mean fluorescence intensity was determined for the total tumor region above the incision line. Linear regression analysis was performed using total fluorescence relative to wet weight (A) or caliper volume (B).
FIGURE 6
FIGURE 6
Positive lymph node identification. Abdominal cavities of mice bearing orthotopic PC3M-LN4 (top) or 22Rv1 (bottom) tumors were opened to reveal the prostate tumors (T) and the para-aortic lymph nodes (LN). White light images (left) of positive and negative nodes were confirmed by fluorescence (center), in which primary tumors are clearly visible in both, but only the PC3M-LN4 nodes fluoresce. After excising or covering the primary tumor, sensitivity of node detection increased (right).
FIGURE 7
FIGURE 7
Hyal1 overexpression does not alter primary orthotopic tumor growth. Male NOD/SCID mice were injected orthotopically with 22Rv1 vector control or full-length Hyal1-transfected tumor cells. A: Animals were monitored longitudinally for tumor growth as described above, but only injected with the targeting agent, and imaged every 2 weeks as indicated. SNR cutoff was used to determine tumor area and total fluorescence, which is plotted for each cohort ± SEM as a measure of tumor growth. B: At the study endpoint, primary prostate tumors were excised to determine weight and caliper volume. Mean values ± SEM were compared and found to be nearly identical. Light bars represent 22Rv1 control tumor parameters and dark bars are 22Rv1 Hyal1 data.
FIGURE 8
FIGURE 8
Hyal1 overexpression induces metastasis to para-aortic lymph nodes. Abdominal cavities of mice bearing orthotopic 22Rv1 control (A and C) or Hyal1-overexpressing (B and D) tumors were opened and reimaged to reveal the prostate tumors (T) and the para-aortic lymph nodes (LN). Primary tumors are clearly visible in both sets of whole animal images (A and B), but node fluorescence was only detected in the animals with tumors overexpressing Hyal1. On covering the primary tumor (C and D), sensitivity of node detection increased, but control nodes remained negative (C), whereas positive nodes in the Hyal1 animals became more defined (D). Insets illustrate H&E-stained frozen sections of the respective excised lymph nodes.

Similar articles

Cited by

References

    1. Hughes C, Murphy A, Martin C, Sheils O, O’Leary J. Molecular pathology of prostate cancer. J Clin Pathol. 2005;58:673–684. - PMC - PubMed
    1. Pienta KJ, Smith DC. Advances in prostate cancer chemotherapy: a new era begins. CA Cancer J Clin. 2005;55:300–323. - PubMed
    1. Cher ML. Mechanisms governing bone metastasis in prostate cancer. Curr Opin Urol. 2001;11:483–488. - PubMed
    1. Ekici S, Cerwinka WH, Duncan R, Gomez P, Civantos F, Soloway MS, Lokeshwar VB. Comparison of the prognostic potential of hyaluronic acid, hyaluronidase (HYAL-1), CD44v6 and microvessel density for prostate cancer. Int J Cancer. 2004;112:121–129. - PubMed
    1. Lokeshwar VB, Cerwinka WH, Isoyama T, Lokeshwar BL. HYAL1 hyaluronidase in prostate cancer: a tumor promoter and suppressor. Cancer Res. 2005;65:7782–7789. - PubMed

Publication types