

Differential effect of cannabinoid agonists and endocannabinoids on histamine release from distinct regions of the rat brain
- PMID: 17004927
- PMCID: PMC1769340
- DOI: 10.1111/j.1460-9568.2006.05046.x
Differential effect of cannabinoid agonists and endocannabinoids on histamine release from distinct regions of the rat brain
Abstract
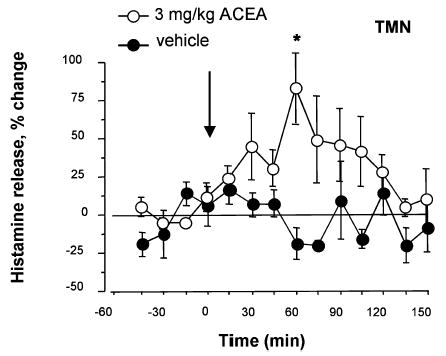
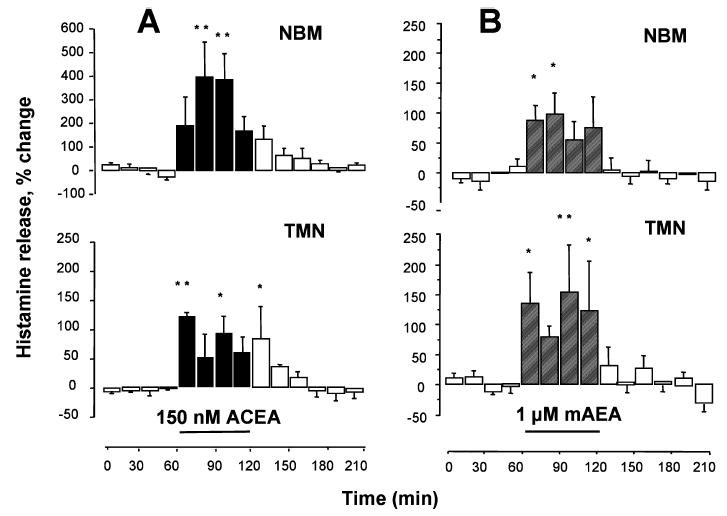
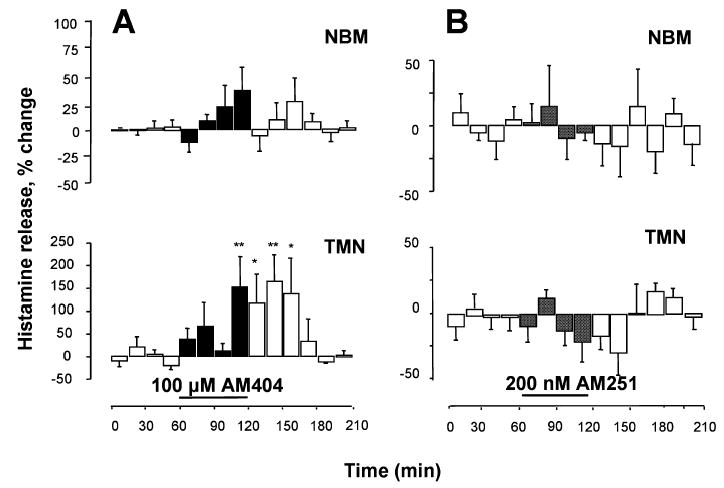
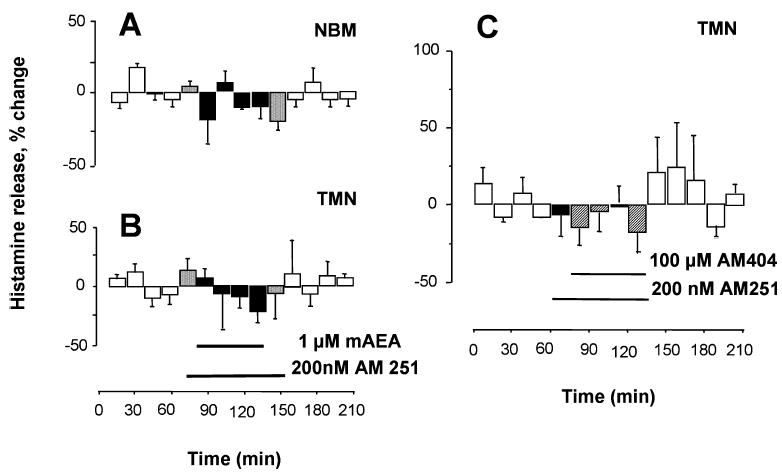
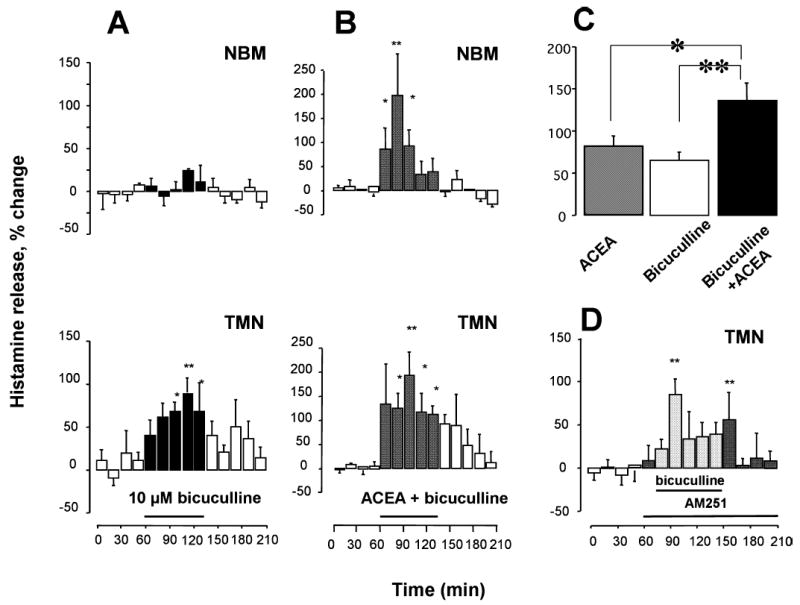
Cannabinoids exert complex actions on neurotransmitter systems involved in cognition, locomotion, appetite, but no information was available so far on the interactions between the endocannabinoid system and histaminergic neurons that command several, similar behavioural states and memory. In this study, we investigated the effect of cannabimimetic compounds on histamine release using the microdialysis technique in the brain of freely moving rats. We found that systemic administration of the cannabinoid receptors 1 (CB1-r) agonist arachidonyl-2'chloroethylamide/N-(2chloroethyl)-5Z,8Z,11Z,14Z-eicosatetraenamide (ACEA; 3 mg/kg) increased histamine release from the posterior hypothalamus, where the histaminergic tuberomamillary nuclei (TMN) are located. Local infusions of ACEA (150 nm) or R(+)-methanandamide (mAEA; 1 microm), another CB1-r agonist, in the TMN augmented histamine release from the TMN, as well as from two histaminergic projection areas, the nucleus basalis magnocellularis and the dorsal striatum. When the endocannabinoid uptake inhibitor AM404 was infused into the TMN, however, increased histamine release was observed only in the TMN. The cannabinoid-induced effects on histamine release were blocked by co-administrations with the CB1-r antagonist AM251. Using double-immunofluorescence labelling and confocal laser-scanning microscopy, CB1-r immunostaining was found in the hypothalamus, but was not localized onto histaminergic cells. The modulatory effect of cannabimimetic compounds on histamine release apparently did not involve inhibition of gamma-aminobutyric acid (GABA)ergic neurotransmission, which provides the main inhibitory input to the histaminergic neurons in the hypothalamus, as local infusions of ACEA did not modify GABA release from the TMN. These profound effects of cannabinoids on histaminergic neurotransmission may partially underlie some of the behavioural changes observed following exposure to cannabinoid-based drugs.
Figures


Similar articles
-
Effect of the CB(1) receptor antagonists rimonabant and AM251 on the firing rate of dorsal raphe nucleus neurons in rat brain slices.Br J Pharmacol. 2009 Nov;158(6):1579-87. doi: 10.1111/j.1476-5381.2009.00434.x. Epub 2009 Oct 20. Br J Pharmacol. 2009. PMID: 19845674 Free PMC article.
-
Heterogeneity of histaminergic neurons in the tuberomammillary nucleus of the rat.Eur J Neurosci. 2009 Jun;29(12):2363-74. doi: 10.1111/j.1460-9568.2009.06765.x. Epub 2009 May 22. Eur J Neurosci. 2009. PMID: 19490084
-
Involvement of cannabinoid receptors in the regulation of neurotransmitter release in the rodent striatum: a combined immunochemical and pharmacological analysis.J Neurosci. 2005 Mar 16;25(11):2874-84. doi: 10.1523/JNEUROSCI.4232-04.2005. J Neurosci. 2005. PMID: 15772347 Free PMC article.
-
Mechanisms of endocannabinoid inactivation: biochemistry and pharmacology.J Pharmacol Exp Ther. 2001 Jul;298(1):7-14. J Pharmacol Exp Ther. 2001. PMID: 11408519 Review.
-
Inverse agonism and neutral antagonism at cannabinoid CB1 receptors.Life Sci. 2005 Feb 4;76(12):1307-24. doi: 10.1016/j.lfs.2004.10.025. Epub 2004 Dec 8. Life Sci. 2005. PMID: 15670612 Review.
Cited by
-
Histamine neurons in the tuberomamillary nucleus: a whole center or distinct subpopulations?Front Syst Neurosci. 2012 May 4;6:33. doi: 10.3389/fnsys.2012.00033. eCollection 2012. Front Syst Neurosci. 2012. PMID: 22586376 Free PMC article.
-
L-Dopa activates histaminergic neurons.J Physiol. 2011 Mar 15;589(Pt 6):1349-66. doi: 10.1113/jphysiol.2010.203257. Epub 2011 Jan 17. J Physiol. 2011. PMID: 21242252 Free PMC article.
-
The Interaction Between the Ventrolateral Preoptic Nucleus and the Tuberomammillary Nucleus in Regulating the Sleep-Wakefulness Cycle.Front Neurosci. 2020 Dec 14;14:615854. doi: 10.3389/fnins.2020.615854. eCollection 2020. Front Neurosci. 2020. PMID: 33381012 Free PMC article.
-
Regional differential effects of the novel histamine H3 receptor antagonist 6-[(3-cyclobutyl-2,3,4,5-tetrahydro-1H-3-benzazepin-7-yl)oxy]-N-methyl-3-pyridinecarboxamide hydrochloride (GSK189254) on histamine release in the central nervous system of freely moving rats.J Pharmacol Exp Ther. 2010 Jan;332(1):164-72. doi: 10.1124/jpet.109.158444. Epub 2009 Oct 8. J Pharmacol Exp Ther. 2010. PMID: 19815811 Free PMC article.
-
Brain Histamine Is Crucial for Selective Serotonin Reuptake Inhibitors' Behavioral and Neurochemical Effects.Int J Neuropsychopharmacol. 2015 Apr 21;18(10):pyv045. doi: 10.1093/ijnp/pyv045. Int J Neuropsychopharmacol. 2015. PMID: 25899065 Free PMC article.
References
-
- Abadji V, Lin S, Taha G, Griffin G, Stevenson L, Pertwee RG, Makriyannis A. (R)-methanandamide: a chiral novel anandamide possessing higher potency and metabolic stability. J Med Chem. 1994;37:1889–1893. - PubMed
-
- Bianchi L, Della Corte L, Tipton KF. Simultaneous determination of basal and evoked output levels of aspartate, glutamate, taurine and 4-aminobutyric acid during microdialysis and from superfused brain slices. J Chromatogr B. 1999;723:47–59. - PubMed
-
- Cecchi M, Passani MB, Bacciottini L, Mannaioni PF, Blandina P. Cortical acetylcholine release elicited by stimulation of histamine H1 receptors in the nucleus basalis magnocellularis: a dual probe microdialysis study in the freely moving rat. Eur J Neurosci. 2001;13:68–78. - PubMed
Publication types
MeSH terms
Substances
Grants and funding
LinkOut - more resources
Full Text Sources
