. 2006 Oct;80(20):9951-61.
doi: 10.1128/JVI.01300-06.

Repression of HMGA2 gene expression by human cytomegalovirus involves the IE2 86-kilodalton protein and is necessary for efficient viral replication and inhibition of cyclin A transcription

Affiliations

Repression of HMGA2 gene expression by human cytomegalovirus involves the IE2 86-kilodalton protein and is necessary for efficient viral replication and inhibition of cyclin A transcription

Mark Shlapobersky et al. J Virol. 2006 Oct.

Abstract

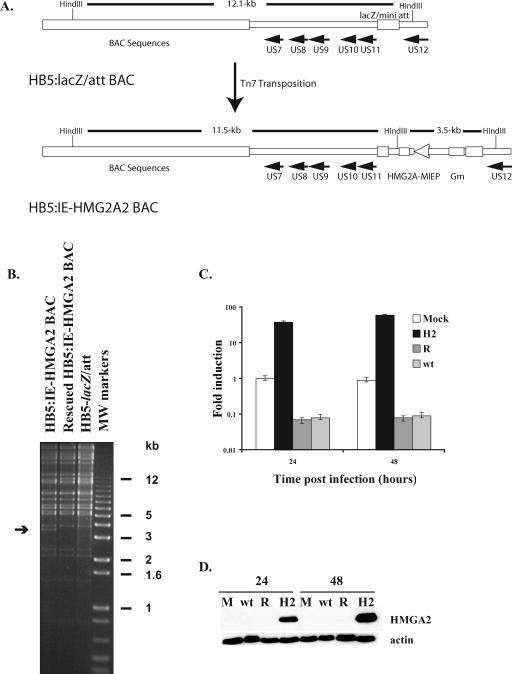
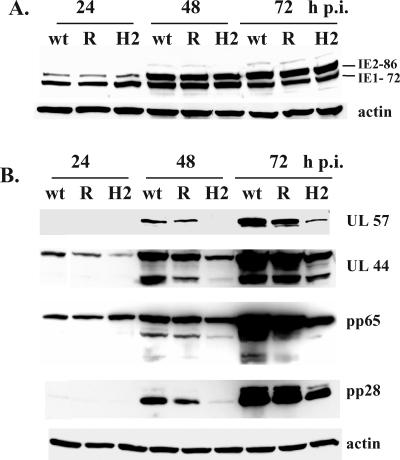
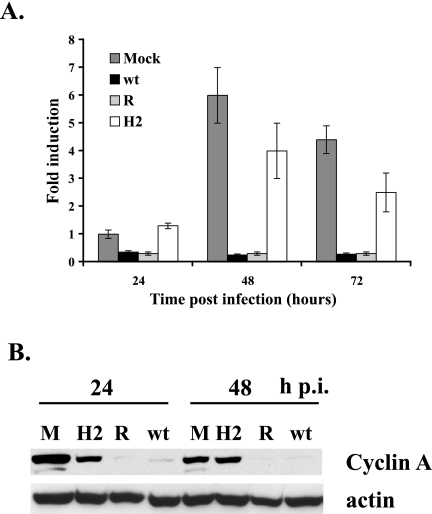
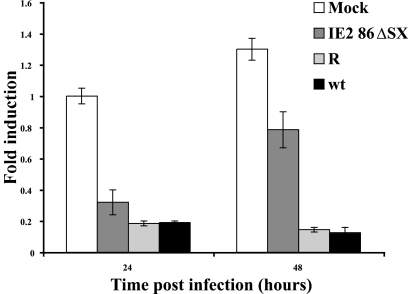
Human cytomegalovirus (HCMV) infection results in dysregulation of several cell cycle genes, including inhibition of cyclin A transcription. In this work, we examine the effect of the HCMV infection on expression of the high-mobility group A2 (HMGA2) gene, which encodes an architectural transcription factor that is involved in cyclin A promoter activation. We find that expression of HMGA2 RNA is repressed in infected cells. To determine whether repression of HMGA2 is directly related to the inhibition of cyclin A expression and impacts on the progression of the infection, we constructed an HCMV recombinant that expressed HMGA2. In cells infected with the recombinant virus, cyclin A mRNA and protein are induced, and there is a significant delay in viral early gene expression and DNA replication. To determine the mechanism of HMGA2 repression, we used recombinant viruses that expressed either no IE1 72-kDa protein (CR208) or greatly reduced levels of IE2 86-kDa (IE2 86) protein (IE2 86DeltaSX-EGFP). At a high multiplicity of infection, the IE1 deletion mutant is comparable to the wild type with respect to inhibition of HMGA2. In contrast, the IE2 86DeltaSX-EGFP mutant does not significantly repress HMGA2 expression, suggesting that IE2 86 is involved in the regulation of this gene. Cyclin A expression is also induced in cells infected with this mutant virus. Since HMGA2 is important for cell proliferation and differentiation, particularly during embryogenesis, it is possible that the repression of HMGA2 expression during fetal development could contribute to the specific birth defects in HCMV-infected neonates.


Figures

FIG. 1.
FIG. 1.
HMGA2 RNA levels are reduced in infected cells. G0-synchronized cells were released into G1 and infected with HCMV Towne at an MOI of 5 or mock infected. Cells were harvested at 8, 24, 48, and 72 h p.i. Total RNA was isolated and analyzed by quantitative real-time RT-PCR to measure levels of transcripts for HMGA2 (A) and HMGA1 (B). RNA levels were normalized to G6PD levels as an internal control for the amount of RNA in each sample. For each time point, two separate experiments were performed and duplicate reactions were analyzed. The mock-infected RNA that was isolated at 24 h p.i. was used to generate a standard curve for each gene. This standard curve was used to calculate the amount of RNA present in each sample. The graph shows the averages of the two experiments, and the range bars indicate the highest and lowest values.
FIG. 2.
FIG. 2.
Construction and characterization of the HB5:IE-HMGA2 BAC. (A) The DNA fragment containing the cDNA encoding HMGA2 was inserted into the HB5-lacZ/att BAC using Tn7 transposition. Gm, gene for gentamicin resistance. (B) The BAC DNAs for HB5-lacZ/att, HB5:IE-HMGA2, and rescued HB5:IE-HMGA2 were digested with HindIII, and the fragments were separated by agarose gel electrophoresis. The arrow shows the position of the 3.5-kbp fragment in the HB5:IE-HMGA2 BAC DNA that contains the HMGA2 cDNA under the control of the MIE promoter. (C and D) G0-synchronized HFF were released into G1 and mock infected or infected with HB5-lacZ/att (wt), HB5:IE-HMGA2 (H2), or rescued HB5:IE-HMGA2 (R) viruses at an MOI of 5. Total RNA or protein was isolated at 24 and 48 h p.i. and analyzed by quantitative real-time RT-PCR to measure the level of HMGA2 RNA or by Western blotting to assess the amount of HMGA2 protein (C and D, respectively). RNA levels were normalized to G6PD levels as an internal control for the amount of RNA in each sample. For each time point, two separate experiments were performed and duplicate reactions were analyzed. The mock-infected RNA that was isolated at 24 h p.i. was used to generate a standard curve for each gene. This standard curve was used to calculate the amount of RNA present in each sample. The graph shows the averages of the two experiments, and the range bars indicate the highest and lowest values. The y axis of the graph is a log scale. (D) Protein samples from an equivalent number of cells were resolved by SDS-PAGE and transferred to nitrocellulose membranes. The membranes were probed with the antibody that detects the HMGA2 protein. Actin was used as a control for equal protein loading. M, mock.
FIG. 3.
FIG. 3.
Viral gene expression is delayed in HFF infected with HMGA2-expressing virus. G0-synchronized cells were released into G1 and infected with HB5-lacZ/att (wt), HB5:IE-HMGA2 (H2), and rescued HB5:IE-HMGA2 (R) viruses at an MOI of 5. Total cell lysates were prepared at 24, 48, and 72 h p.i., and protein samples from an equivalent number of cells were resolved by SDS-PAGE and transferred to nitrocellulose membranes. The membranes were probed with the MAb CH16.0, which detects the HCMV IE1 and IE2 proteins (A) or MAbs that detect the UL57, UL44, pp65, and pp28 viral proteins (B). Actin was used as a control for equal protein loading.
FIG. 4.
FIG. 4.
Viral DNA replication is delayed in cells infected with HMGA2-expressing virus. G0-synchronized cells were released into G1 and infected with HB5-lacZ/att (wt), HB5:IE-HMGA2 (H2), and rescued HB5:IE-HMGA2 (R) viruses at an MOI of 5. DNA was isolated from cells at 24, 48, and 72 h p.i., and the level of viral DNA was measured by quantitative real-time PCR using primers and probe to the HCMV UL77 gene as described in Materials and Methods. DNA levels were normalized to G6PD levels as an internal control for the amount of DNA in each sample. For each time point, two separate experiments were performed and duplicate reactions were analyzed. The graph shows the averages of the two experiments, and the range bars indicate the highest and lowest values. One of these experiments was the same as that shown in Fig. 3.
FIG. 5.
FIG. 5.
An HMGA2-expressing virus induces cyclin A expression following high-MOI infection. (A) RNA that was isolated at 24, 48, and 72 h p.i. from the same two infections as shown in Fig. 4 was analyzed by quantitative real-time RT-PCR using primers and probe for the cyclin A transcript. RNA levels were normalized to G6PD levels as an internal control for the amount of RNA in each sample. The mock-infected RNA that was isolated at 24 h p.i. was used to generate a standard curve for each gene. This standard curve was used to calculate the amount of RNA present in each sample. The graph shows the averages of the two experiments, and the range bars indicate the highest and lowest values. (B) The lysates from the cells harvested at 24 and 48 h p.i. in one of these duplicate experiments (the same experiment as that shown in Fig. 3) were analyzed by Western blotting with an antibody to cyclin A. Actin served as a control for protein loading in each lane, and the lysates in the lanes were from an equal number of cells. M, mock infection.
FIG. 6.
FIG. 6.
Expression of HMGA2 RNA in HCMV-infected HFF depends on IE2 86 but not IE1 72 protein levels. (A) G0-synchronized cells were released into G1 and mock infected or infected with IE1 72 mutant (CR208) virus or rescued (CR249) virus. Cells were harvested at 24 and 48 h p.i. Total RNA was isolated and analyzed by quantitative real-time RT-PCR to measure levels of HMGA2 RNA. RNA levels were normalized to G6PD levels as an internal control for the amount of RNA in each sample. For each time point, two separate experiments were performed and duplicate reactions were analyzed. The mock-infected RNA that was isolated at 24 h p.i. was used to generate a standard curve for each gene. This standard curve was used to calculate the amount of RNA present in each sample. The graph shows the averages of the two experiments, and the range bars indicate the highest and lowest values. (B to D) G0-synchronized cells were released into G1 and mock infected or infected with IE2 86-EGFP (wt), IE2 86ΔSX-EGFP (Δ), and IE2 86ΔSX-EGFP rescued (R) viruses at an MOI of 5. Cells were harvested at 24, 48, and 96 h p.i. (B) Quantitative real-time RT-PCR analysis of 24-h and 48-h samples using specific primers and probe for the HMGA2 transcript. RNA levels were normalized to G6PD levels as an internal control for the amount of RNA in each sample. For each time point, three separate experiments were performed and duplicate reactions were analyzed. The graph shows the averages of the three experiments, and the ranges of the highest and lowest values are indicated. (C) Northern blot analysis of mRNA isolated at 24 and 96 h p.i. with an HMGA2-specific probe. The blot was stripped and hybridized to a GAPDH-specific probe as a loading control. M, mock infection. (D) Western blot analysis of the viral IE1 72 and IE2 86 proteins in the samples harvested at 24 and 96 h p.i. using the MAb CH16.0. Levels of cellular actin were used as a protein loading control.
FIG. 7.
FIG. 7.
HFF infected with the recombinant mutant virus IE2 86ΔSX-EGFP exhibit elevated cyclin A expression. RNA that was isolated at 24 and 48 h p.i. from two of the three infections shown in Fig. 6B was analyzed by quantitative real-time RT-PCR using primers and probe for the cyclin A transcript. RNA levels were normalized to G6PD levels as an internal control for the amount of RNA in each sample. The mock-infected RNA that was isolated at 24 h p.i. was used to generate a standard curve for each gene. This standard curve was used to calculate the amount of RNA present in each sample. The graph shows the averages of the two experiments, and the range bars indicate the highest and lowest values.

Similar articles

Cited by

References

    1. Ahn, J. H., Y. Xu, W. J. Jang, M. J. Matunis, and G. S. Hayward. 2001. Evaluation of interactions of human cytomegalovirus immediate-early IE2 regulatory protein with small ubiquitin-like modifiers and their conjugation enzyme Ubc9. J. Virol. 75:3859-3872. - PMC - PubMed
    1. Anand, A., and K. Chada. 2000. In vivo modulation of Hmgic reduces obesity. Nat. Genet. 24:377-380. - PubMed
    1. Arlotta, P., A. K. Tai, G. Manfioletti, C. Clifford, G. Jay, and S. J. Ono. 2000. Transgenic mice expressing a truncated form of the high mobility group I-C protein develop adiposity and an abnormally high prevalence of lipomas. J. Biol. Chem. 275:14394-14400. - PubMed
    1. Baldassarre, G., M. Fedele, S. Battista, A. Vecchione, A. J. Klein-Szanto, M. Santoro, T. A. Waldmann, N. Azimi, C. M. Croce, and A. Fusco. 2001. Onset of natural killer cell lymphomas in transgenic mice carrying a truncated HMGI-C gene by the chronic stimulation of the IL-2 and IL-15 pathway. Proc. Natl. Acad. Sci. USA 98:7970-7975. - PMC - PubMed
    1. Barrasa, M. I., N. Y. Harel, and J. C. Alwine. 2005. The phosphorylation status of the serine-rich region of the human cytomegalovirus 86-kilodalton major immediate-early protein IE2/IEP86 affects temporal viral gene expression. J. Virol. 79:1428-1437. - PMC - PubMed

Publication types

MeSH terms

LinkOut - more resources