. 2006 Oct;80(20):10073-82.
doi: 10.1128/JVI.01156-06.

Asynchronous progression through the lytic cascade and variations in intracellular viral loads revealed by high-throughput single-cell analysis of Kaposi's sarcoma-associated herpesvirus infection

Affiliations

Asynchronous progression through the lytic cascade and variations in intracellular viral loads revealed by high-throughput single-cell analysis of Kaposi's sarcoma-associated herpesvirus infection

Laura A Adang et al. J Virol. 2006 Oct.

Abstract

Kaposi's sarcoma-associated herpesvirus (KSHV or human herpesvirus-8) is frequently tumorigenic in immunocompromised patients. The average intracellular viral copy number within infected cells, however, varies markedly by tumor type. Since the KSHV-encoded latency-associated nuclear antigen (LANA) tethers viral episomes to host heterochromatin and displays a punctate pattern by fluorescence microscopy, we investigated whether accurate quantification of individual LANA dots is predictive of intracellular viral genome load. Using a novel technology that integrates single-cell imaging with flow cytometry, we found that both the number and the summed immunofluorescence of individual LANA dots are directly proportional to the amount of intracellular viral DNA. Moreover, combining viral (immediate early lytic replication and transcription activator [RTA] and late lytic K8.1) and cellular (syndecan-1) staining with image-based flow cytometry, we were also able to rapidly and simultaneously distinguish among cells supporting latent, immediate early lytic, early lytic, late lytic, and a potential fourth "delayed late" category of lytic replication. Applying image-based flow cytometry to KSHV culture models, we found that de novo infection results in highly varied levels of intracellular viral load and that lytic induction of latently infected cells likewise leads to a heterogeneous population at various stages of reactivation. These findings additionally underscore the potential advantages of studying KSHV biology with high-throughput analysis of individual cells.


Figures

FIG. 1.
FIG. 1.
KSHV-infected HeLa cells are effectively separated by LANA dot fluorescence by use of multispectral imaging flow cytometry. (A) To more accurately measure cell morphological characteristics, the contours of the cells were mapped by creating a mask, as shown in the blue overlay (right column, Mask +) (default bright-field mask eroded by 2 or 3 pixels). Representative cells are shown with and without the mask. (B) Single cells were gated by graphing the mask-corrected parameters of aspect ratio and area. Gate R1 represents nonclumped, single cells, which can be confirmed visually by selecting individual dots in the scatter plot (left column). Aggregated cells, gate R2, were not included in further analyses (right column). (C) A population of KSHV-infected HeLa cells displays heterogeneous LANA dot fluorescence. To determine if the variation in LANA dot fluorescence correlates with nuclear focal maxima of fluorescence, peaks 1 to 4 were selected for further visual analysis. (D) Representative images from cells comprising peaks 1 to 4 indicate that increasing LANA dot fluorescence correlates with increasing LANA dot number. Staining represents DRAQ5 (NUC) and LANA antibody conjugated to Alexa 488 (LANA). The images on the left side of each column, for LANA alone, are shown in black and white. In the superimposed pictures, LANA appears yellow-green over a red nucleus.
FIG. 2.
FIG. 2.
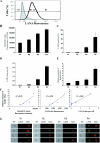
Number of LANA dots per cell directly correlates with intracellular KSHV DNA. (A) To simultaneously assess the correlation between LANA dots and KSHV episome copy number within a population and test the ability of MIFC to detect low and high frequencies of LANA dots within cells, KSHV-infected HeLa cells were physically sorted into four groups using nonoverlapping gates (R1 to R4) based on LANA fluorescence intensity. Unstained control cells are shown in the shaded overlay histogram. (B) The traditional flow cytometry measurement of the geometric mean fluorescence ± SEM of LANA dots was measured by MIFC in sorted samples. (C) The mean percentage (n = 2) ± range of LANA-positive cells was determined by the percentage of cells with a threshold level of LANA dot fluorescence intensity (see Materials and Methods). (D) The average numbers ± SEM of LANA dots per cell within each sorted population were visually counted. (E) Relative amount of KSHV DNA normalized to cellular GAPDH and arbitrarily set to a value of 1 for gate R1. (F) Relationships between relative amount of KSHV DNA per sorted sample and MIFC measurements of LANA: geometric mean fluorescence intensity (R2 = 0.78), LANA dot fluorescence (R2 = 0.90), and LANA dots per cell (R2 = 0.99). Error bars were omitted for clarity; refer to panels B, D, and E. (G) Representative MIFC images from each gate of bright-field (BF), LANA, and nuclear (NUC) staining. For ease of visualization, we selected images for each category at the upper end of the range of LANA dots per cell.
FIG. 3.
FIG. 3.
Characterization of the KSHV latent-to-lytic switch in stably infected BCBL-1 cells. (A) BCBL-1 cells were treated with valproate to induce productive lytic replication. The percentages ± ranges (n = 2) of cells positive for syndecan-1, LANA, RTA, and K8.1 following lytic induction were calculated by MIFC. For RTA, values represent means of samples ± standard deviations (n = 2 for 24 and 48 h; n = 4 for 0 and 72 h). (B) Representative images of BCBL-1 cells 0, 24, 48, and 72 h after valproic acid induction of the viral lytic cycle. Images represent bright-field-masked cells (BF), LANA, syndecan-1 (SDC-1), K8.1, and DRAQ5 (NUC). (C) K8.1 expression is exclusive of syndecan-1 expression at both 0 and 72 h after lytic induction, and less than 1 percent of cells are copositive.
FIG. 4.
FIG. 4.
Visualization of BCBL-1 cells reveals four distinct lytic subpopulations. BCBL-1 cells were lytically reactivated with valproate, and protein expression within individual cells was measured by MIFC. (A) Images representing the distinct phases of syndecan-1 (SDC-1), RTA, and K8.1 expression are shown in addition to images of bright-field-masked cells (BF) and nuclei as stained by DRAQ5 (NUC). Proposed corresponding viral phases are indicated to the left as latent, immediate early (IE), early (E), late (L), and delayed late (L*). Note that there are two distinct populations clustered into the late category. Cells chosen are all from the 48-hour time point. (B) Percentage of BCBL-1 cells in each of the viral lytic subcategories at 0, 24, 48, and 72 h. Black bars represent IE, gray early, and white late. The IE population has its greatest period of expansion between 0 and 24 h, the early population between 24 and 48 h, and the late population between 48 and 72 h.

Similar articles

Cited by

References

    1. Asahi-Ozaki, Y., Y. Sato, T. Kanno, T. Sata, and H. Katano. 2006. Quantitative analysis of Kaposi sarcoma-associated herpesvirus (KSHV) in KSHV-associated diseases. J. Infect. Dis. 193:773-782. - PubMed
    1. Ballestas, M. E., P. A. Chatis, and K. M. Kaye. 1999. Efficient persistence of extrachromosomal KSHV DNA mediated by latency-associated nuclear antigen. Science 284:641-644. - PubMed
    1. Barbera, A. J., J. V. Chodaparambil, B. Kelley-Clarke, V. Joukov, J. C. Walter, K. Luger, and K. M. Kaye. 2006. The nucleosomal surface as a docking station for Kaposi's sarcoma herpesvirus LANA. Science 311:856-861. - PubMed
    1. Canham, M., and S. J. Talbot. 2004. A naturally occurring C-terminal truncated isoform of the latent nuclear antigen of Kaposi's sarcoma-associated herpesvirus does not associate with viral episomal DNA. J. Gen. Virol. 85:1363-1369. - PubMed
    1. Chandran, B., C. Bloomer, S. R. Chan, L. J. Zhu, E. Goldstein, and R. Horvat. 1998. Human herpesvirus-8 ORF K8.1 gene encodes immunogenic glycoproteins generated by spliced transcripts. Virology 249:140-149. - PubMed

Publication types