. 2006 Oct;80(20):10151-61.
doi: 10.1128/JVI.02670-05.

CD127+CCR5+CD38+++ CD4+ Th1 effector cells are an early component of the primary immune response to vaccinia virus and precede development of interleukin-2+ memory CD4+ T cells

Affiliations

CD127+CCR5+CD38+++ CD4+ Th1 effector cells are an early component of the primary immune response to vaccinia virus and precede development of interleukin-2+ memory CD4+ T cells

John J Zaunders et al. J Virol. 2006 Oct.

Abstract

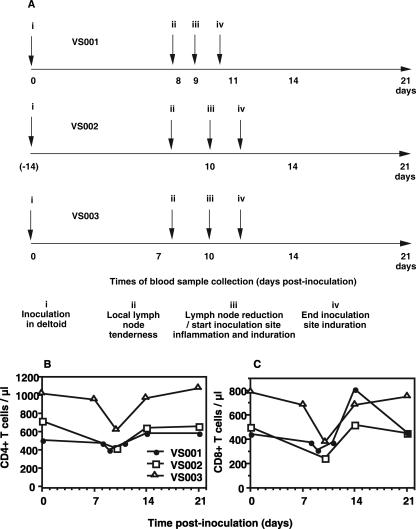
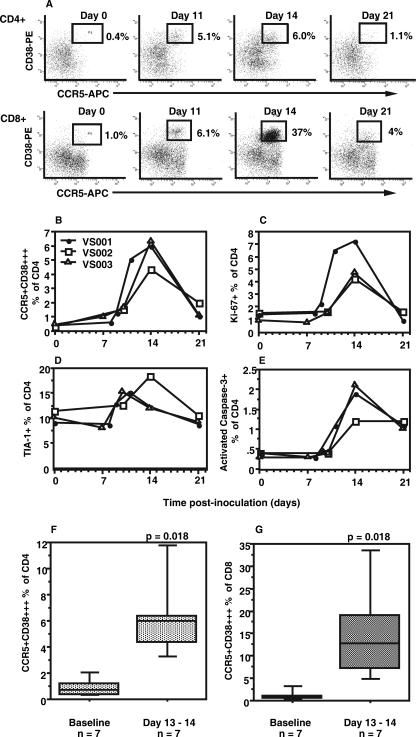
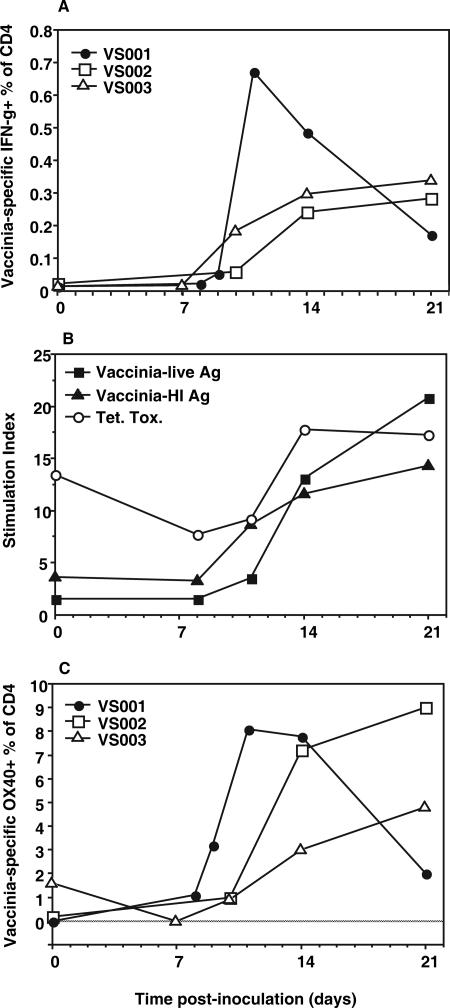
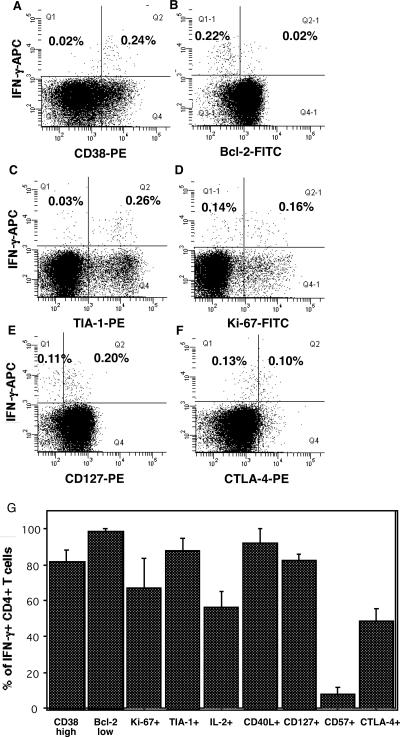
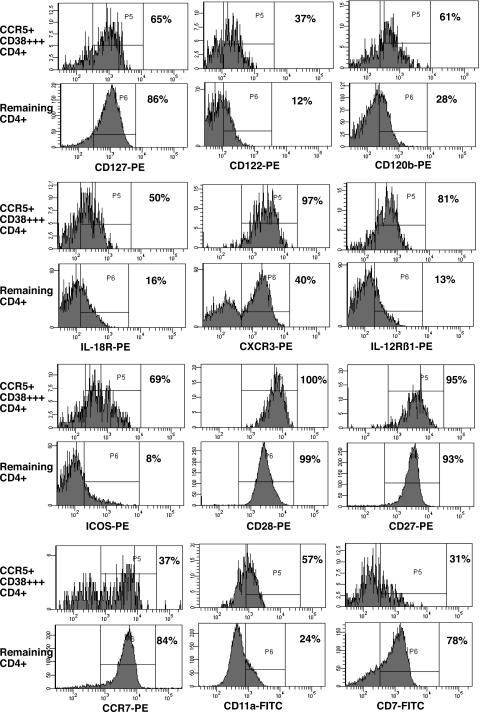
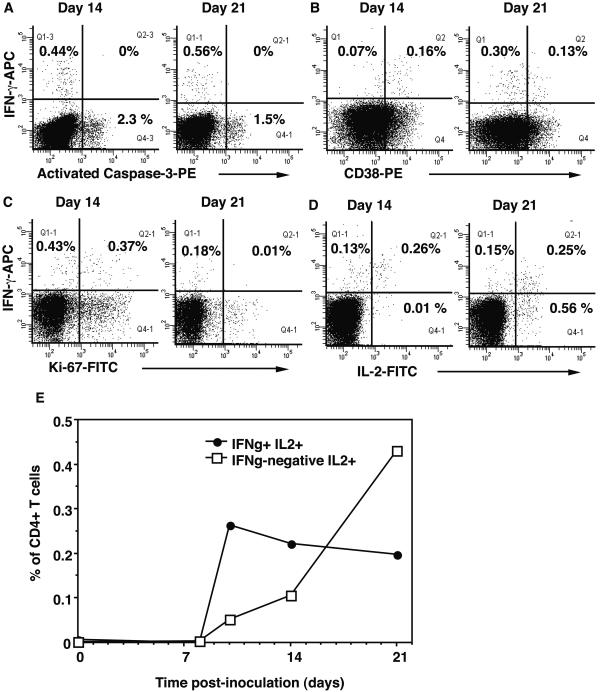
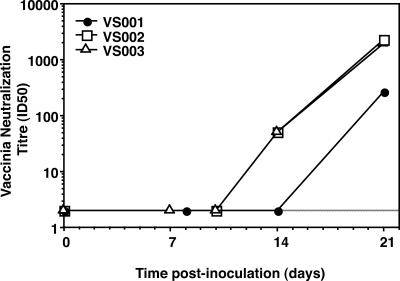
The stages of development of human antigen-specific CD4+ T cells responding to viral infection and their differentiation into long-term memory cells are not well understood. The inoculation of healthy adults with vaccinia virus presents an opportunity to study these events intensively. Between days 11 and 14 postinoculation, there was a peak of proliferating CCR5+CD38+++ CD4+ effector cells which contained the cytotoxic granule marker T-cell intracellular antigen 1 and included gamma interferon (IFN-gamma)-producing vaccinia virus-specific CD4+ T cells. The majority of these initial vaccinia virus-specific CD4+ T cells were CD127+ and produced interleukin-2 (IL-2) but not CTLA-4 in response to restimulation in vitro. Between days 14 and 21, there was a switch from IFN-gamma and IL-2 coexpression to IL-2 production only, coinciding with a resting phenotype and an increased in vitro proliferation response. The early CCR5+CD38+++ vaccinia virus-specific CD4+ T cells were similar to our previous observations of human immunodeficiency virus (HIV)-specific CD4+ T cells in primary HIV type 1 (HIV-1) infection, but the vaccinia virus-specific cells expressed much more CD127 and IL-2 than we previously found in their HIV-specific counterparts. The current study provides important information on the differentiation of IL-2+ vaccinia virus-specific memory cells, allowing further study of antiviral effector CD4+ T cells in healthy adults and their dysfunction in HIV-1 infection.


Figures

FIG. 1.
FIG. 1.
Clinical course following inoculation. (A) The timelines of clinical features, following inoculation at day 0, are shown above the line for each individual. For each subject, the roman numerals and arrows indicate the sequence of clinical features, while the numbers under the timelines show when peripheral blood samples were collected. Changes in (B) CD4 T-cell counts and (C) CD8 T-cell counts, following inoculation with vaccinia virus, are also shown.
FIG. 2.
FIG. 2.
Kinetics of changes in CD4+ T-cell subsets following inoculation with vaccinia virus. (A) Flow cytometric histograms of CCR5+CD38+++ CD4+ (upper histograms) and CCR5+CD38+++ CD8+ T cells (lower histograms) for subject VS001. Also shown are kinetics of (B) CCR5+CD38+++ CD4+ T cells for individual subjects, (C) proliferating (Ki-67+) CD4+ T cells, (D) TIA-1+ CD4+ T cells, and (E) spontaneously apoptotic (activated caspase-3+) CD4+ T cells. For the symbol keys for panels C, D, and E, see panel B. The increases in CCR5+ CD38+++ cells in CD4+ and CD8+ T cells from baseline to day 13 or 14 for all seven subjects studied are summarized in panels F and G, respectively. Box plots represent 10th, 25th, 50th, 75th, and 90th percentiles. The P values shown were determined by the paired nonparametric Wilcoxon signed-rank test.
FIG. 3.
FIG. 3.
Kinetics of vaccinia virus-specific CD4+ T cells. Appearance of vaccinia virus-specific CD4+ T cells following inoculation with vaccinia virus, including (A) total IFN-γ+ CD4+ T cells in response to vaccinia virus heat-inactivated antigen (HI Ag) by intracellular cytokine assay (average of six replicates) for each subject, (B) average PBMC lymphoproliferation stimulation index (for all three subjects) in response to vaccinia virus antigen preparations (live Ag and HI Ag) and tetanus toxoid recall antigens, and (C) appearance of OX40+ CD4+ T cells in response to vaccinia virus HI Ag in whole-blood cultures for each individual.
FIG. 4.
FIG. 4.
Characterization of vaccinia virus-specific CD4+ T cells at day 14. Phenotype of vaccinia virus-specific CD4+ T cells at day 14, including (A) CD38++ IFN-γ+ CD4+ T cells, (B) Bcl-2 low IFN-γ+ CD4+ T cells, (C) TIA-1+ IFN-γ+ CD4+ T cells, (D) Ki-67+ IFN-γ+ CD4+ T cells, (E) CD127+ IFN-γ+ CD4+ T cells, and (F) CTLA-4+ IFN-γ+ CD4+ T cells. Representative histograms are shown, with similar results obtained for subjects VS001, -2, and -3; the percentages of CD3+CD4+ cells in relevant quadrants are shown. Cursor settings for panel A are based on results from Fig. 2, and those for panel B are based on results from previous studies (55, 56). The overall phenotype of IFN-γ+ vaccinia virus-specific CD4+ T cells for subjects VS001, -2, and -3 is shown in panel G, representing mean ± standard error (error bars) for each marker for all three subjects.
FIG. 5.
FIG. 5.
Detailed phenotype of CCR5+CD38+++ CD4+ T cells at day 14. Analysis of various markers on CCR5+CD38+++ CD4+ T cells at day 14. For each marker, a pair of histograms is shown: the upper histogram is gated on CCR5+CD38+++ CD4+ T cells and the lower histogram is gated on remaining CD4+ T cells (Fig. 2A). The histograms shown are for subject VS003; similar results were obtained for subject VS002. The percentage of positive cells is shown for each histogram.
FIG. 6.
FIG. 6.
Comparison of vaccinia virus-specific CD4+ T cells at days 14 and 21. Attributes of vaccinia virus-specific IFN-γ+ CD4+ T cells at day 14 and day 21 are shown, including the coexpression of (A) activated caspase-3, (B) CD38, (C) Ki-67, and (D) IL-2. The results shown are representative of all three subjects, and the percentages of CD3+CD4+ cells in relevant quadrants are shown in the histograms. (E) The coexpression of IFN-γ by vaccinia virus-specific IL-2+ CD4+ T cells over time is also shown. The results shown represent the average for all three subjects.
FIG. 7.
FIG. 7.
Appearance of neutralizing antibodies. The titers of vaccinia virus-specific neutralizing antibodies, following inoculation, are shown for each vaccinia virus-naïve subject.

Similar articles

Cited by

References

    1. Amyes, E., C. Hatton, D. Montamat-Sicotte, N. Gudgeon, A. B. Rickinson, A. J. McMichael, and M. F. Callan. 2003. Characterization of the CD4+ T cell response to Epstein-Barr virus during primary and persistent infection. J. Exp. Med. 198:903-911. - PMC - PubMed
    1. Appay, V., J. J. Zaunders, L. Papagno, J. Sutton, A. Jaramillo, A. Waters, P. Easterbrook, P. Grey, D. Smith, A. J. McMichael, D. A. Cooper, S. L. Rowland-Jones, and A. D. Kelleher. 2002. Characterization of CD4+ CTLs ex vivo. J. Immunol. 168:5954-5958. - PubMed
    1. Bertram, E. M., W. Dawicki, and T. H. Watts. 2004. Role of T cell costimulation in anti-viral immunity. Semin. Immunol. 16:185-196. - PubMed
    1. Bertram, E. M., A. Tafuri, A. Shahinian, V. S. Chan, L. Hunziker, M. Recher, P. S. Ohashi, T. W. Mak, and T. H. Watts. 2002. Role of ICOS versus CD28 in antiviral immunity. Eur. J. Immunol. 32:3376-3385. - PubMed
    1. Bossi, G., and G. M. Griffiths. 2005. CTL secretory lysosomes: biogenesis and secretion of a harmful organelle. Semin. Immunol. 17:87-94. - PubMed

Publication types

MeSH terms