. 2006 Sep 27;26(39):9851-9.
doi: 10.1523/JNEUROSCI.1862-06.2006.

Na+, Cl-, and pH dependence of the human choline transporter (hCHT) in Xenopus oocytes: the proton inactivation hypothesis of hCHT in synaptic vesicles

Affiliations

Na+, Cl-, and pH dependence of the human choline transporter (hCHT) in Xenopus oocytes: the proton inactivation hypothesis of hCHT in synaptic vesicles

Hideki Iwamoto et al. J Neurosci. .

Abstract

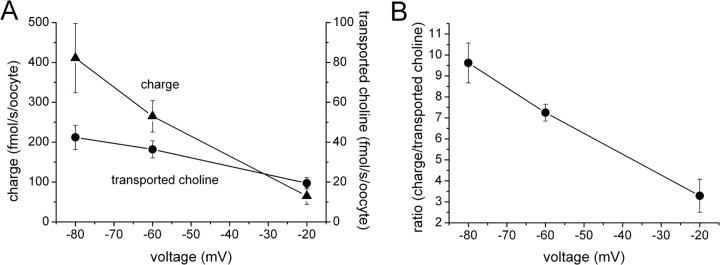
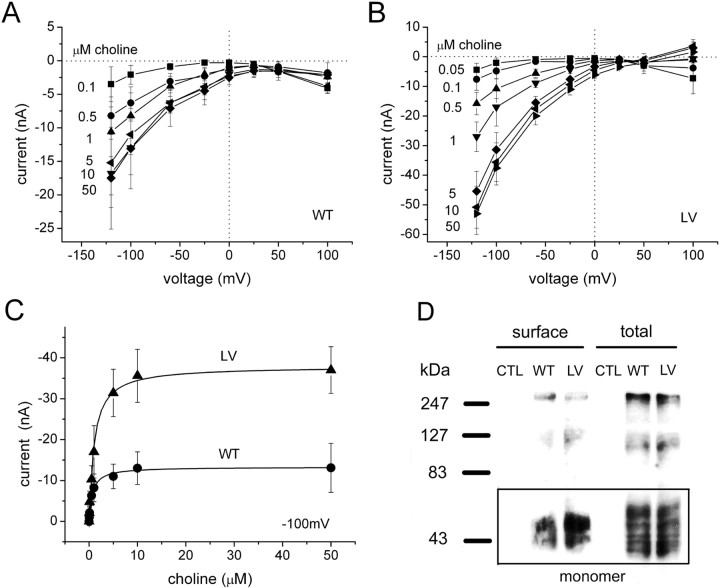
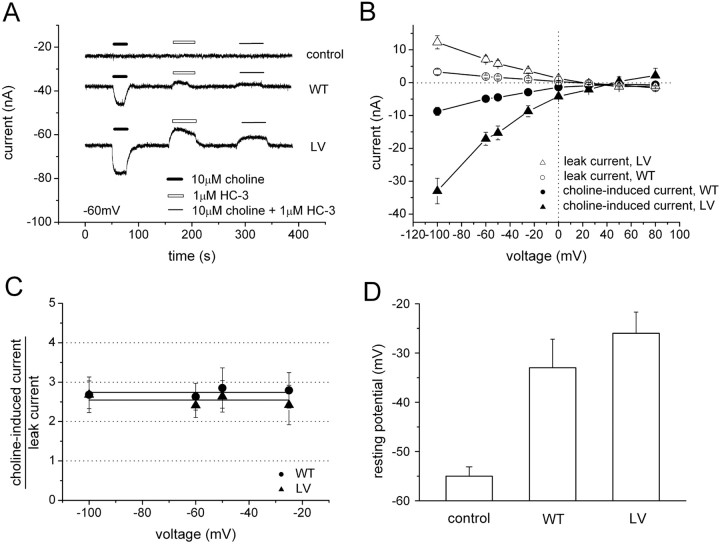
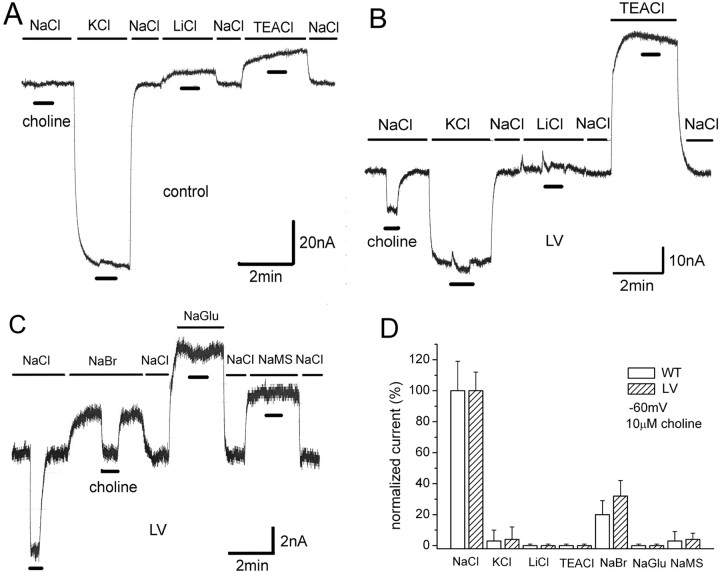
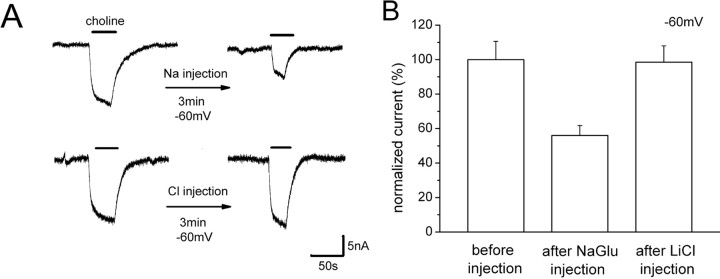
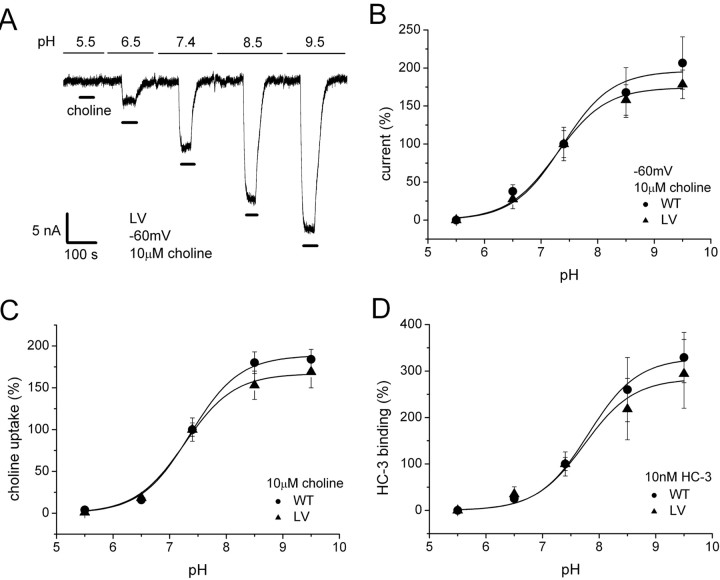
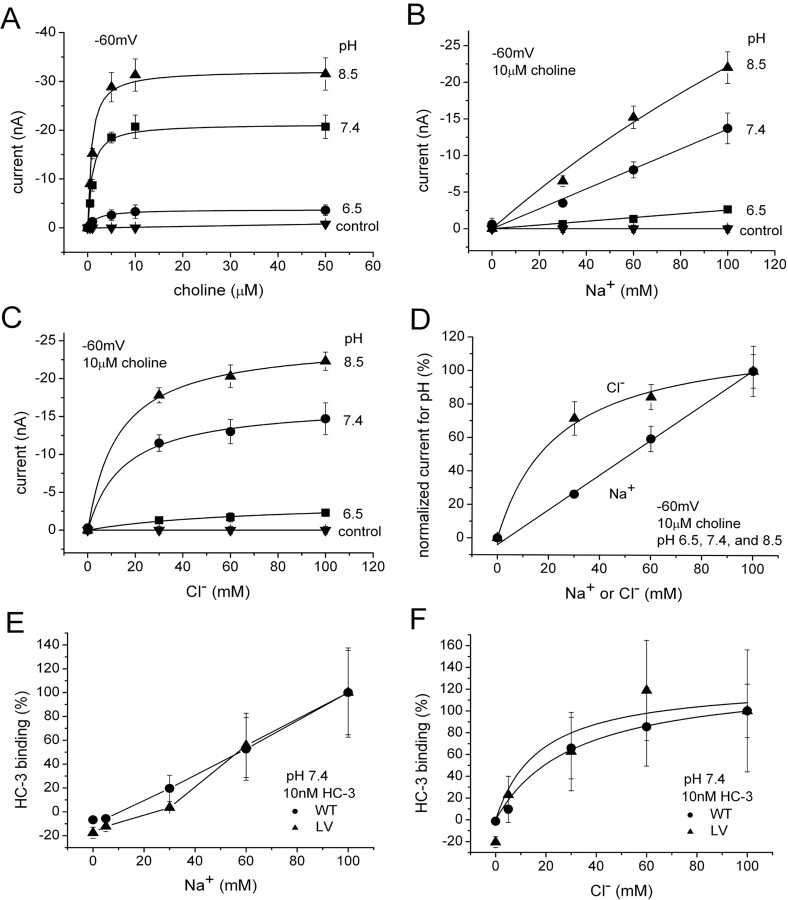
The recent cloning of the human choline transporter (hCHT) has allowed its expression in Xenopus laevis oocytes and the simultaneous measurement of choline transport and choline-induced current under voltage clamp. hCHT currents and choline transport are evident in cRNA-injected oocytes and significantly enhanced by the hCHT trafficking mutant L530A/V531A. The charge/choline ratio of hCHT varies from 10e/choline at -80 mV to 3e/choline at -20 mV, in contrast with the reported fixed stoichiometry of the Na+-coupled glucose transporter in the same gene family. Ion substitution shows that the choline uptake and choline-induced current are Na+ and Cl- dependent; however, the reversal potential of the induced current suggests a Na+-selective mechanism, consigning Cl- to a regulatory role rather than a coupled, cotransported-ion role. The hCHT-specific inhibitor hemicholinium-3 (HC-3) blocks choline uptake and choline-induced current; in addition, HC-3 alone reveals a constitutive, depolarizing leak current through hCHT. We show that external protons reduce hCHT current, transport, and binding with a similar pKa of 7.4, suggesting proton titration of residue(s) that support choline binding and transport. Given the localization of the choline transporter to synaptic vesicles, we propose that proton inactivation of hCHT prevents acetylcholine and proton leakage from the acidic interior of cholinergic synaptic vesicles. This mechanism would allow cholinergic, activity-triggered delivery of silent choline transporters to the plasma membrane, in which normal pH would reactivate the transporters for choline uptake and subsequent acetylcholine synthesis.


Figures

Figure 1.
Figure 1.
Choline uptake and choline-induced current in hCHT-expressing oocytes. A, Uptake assays were performed with 10 μm choline containing 1% [3H]choline and measured over a period of 30 min in both hCHT WT-expressing and LV-expressing oocytes with and without 10 min preincubation of the hCHT-specific inhibitor HC-3 at 1 μm (n = 5–8). B, The choline-induced I–V curves were generated by brief exposure to 10 μm choline at various membrane potentials (n = 5). Baseline current in the absence of choline was subtracted from the choline-induced current. Inset, Choline at 10 μm induced a significant current when the oocyte was held at −60 mV. Note that the holding currents in WT- and LV-expressing oocyte are shifted compared with control oocyte.
Figure 2.
Figure 2.
Simultaneous measurement of uptake and current. A, Choline at 10 μm containing 1% [3H]choline induced current and promoted choline uptake, which were measured concurrently in the same oocyte under voltage clamp for 500 s (for details, see Materials and Methods). Each point consists of data from three to four different oocytes. The LV mutant was used in this experiment. B, The charge/substrate ratio is plotted as a function of voltage from the data in A.
Figure 3.
Figure 3.
The I–V curves for WT and LV transporters for various choline concentrations. I–V curves measured with choline concentrations from 0.05 to 50 μm for WT (A) and the LV mutant (B) (n = 5). C, From A and B, the currents at −100 mV are plotted for different choline concentrations. These data were then fit to a Michaelis–Menten equation to obtain the apparent affinity (K m) and maximal current (I max). K m of 0.7 ± 0.1 μm and I max of −13.3 ± 0.2 nA for WT. K m of 1.0 ± 0.1 μm and I max of −37.9 ± 0.3 nA for LV. D, Surface biotinylation Western blotting. Water-injected control oocytes show no detectable hCHT expression (CTL). A rectangular box represents hCHT monomers. Band densities of surface fraction at 55 kDa show that LV is 2.6 ± 0.3 times greater than WT (n = 3), consistent with I max differences between LV and WT. Total expression for WT and LV show no significant differences (Student's t test, p > 0.05; n = 3).
Figure 4.
Figure 4.
HC-3 inhibits choline-induced current. A, HC-3 at 1 μm inhibits the choline-induced current (10 μm choline at −60 mV). Perfusion of 1 μm HC-3 alone reveals an apparent outward current (leak) in the transporter (white bar). There was no detectable leak current for control oocytes under the same conditions. A slow baseline drift was removed from A. B, I–V curves for 10 μm choline-induced current and 1 μm HC-3-revealed leak current were obtained from WT and LV mutants (n = 5). C, The ratio of choline-induced current to HC-3-revealed leak current is calculated from B. The ratio is constant at any voltage for either WT or LV. D, Leak current depolarizes oocytes. Resting potentials were assessed in water-injected control oocytes, WT-expressing oocytes, and LV-expressing oocytes in the absence of choline. Compared with the water-injected control oocytes, resting potentials in WT- and LV-expressing oocytes were significantly depolarized (n = 7).
Figure 5.
Figure 5.
The role of cations and anions in the choline-induced current. A, The effect of cation substitutions in control oocytes. NaCl at 100 mm was replaced with equimolar KCl, LiCl, or TEACl. No choline-induced current was observed when 10 μm choline (thick black bars) was perfused onto water-injected control oocytes held at −60 mV. The baseline is normalized to the value in NaCl. B, Effect of cation substitutions in LV oocytes. Choline-induced current is observed only in NaCl. The magnitude of baseline shift with cation substitution is different LV oocytes compared with control oocytes. C, Effect of anion substitutions in LV-expressing oocytes. NaCl at 100 mm was replaced with equimolar NaBr, NaGlu, or NaMS. Choline-induced current was observed only in NaCl and NaBr. No choline-induced current was observed in water-injected control oocytes. The magnitude of baseline shift with anion substitution is different LV oocytes compared with control oocytes (data not shown). D, Summary of cation and anion dependence of choline-induced current (n = 5). Choline-induced current depends strictly on Na+ but less stringently on Cl, because Br can partially replace Cl. Essentially no difference exists in ionic dependence between WT and LV hCHT-expressing oocytes.
Figure 6.
Figure 6.
Internal Na+, but not Cl, suppresses the choline-induced current. A, Top row, NaGlu (46 nl of 0.5 m) was injected into LV-expressing oocytes. The final concentration of internal NaGlu is ∼23 mm NaGlu in oocytes, assuming a volume of 1 μl. The figure shows typical data in 10 μm choline before and 3 min after the injection, in oocytes held at −60 mV. A, Bottom row, LiCl (46 nl of 0.5 m) was injected into an LV-expressing oocyte. The final concentration of LiCl inside is ∼23 mm. Similar to A, the 10 μm choline-induced current was monitored at −60 mV before and 3 min after the injection. B, Summary. The effect of NaGlu and LiCl injections on choline-induced current. The currents are normalized to the current before injection (100 ± 10.6%; n = 4). Internal NaGlu reduced the induced current by 50% 3–5 min after the injection (56.0 ± 5.8%; n = 4). However, internal LiCl had almost no effect on the induced current (98.5 ± 9.5%; n = 4).
Figure 7.
Figure 7.
pH dependence of choline-induced current, choline uptake, and HC-3 binding. A, pH dependence of choline-induced current. Typical data are shown for 10 μm choline-induced current for LV at −60 mV in 100 mm NaCl buffer. The slow baseline drift is removed from the figure. B, pH dependence of 10 μm choline-induced currents at −60 mV are measured for WT and LV (n = 5). The data were normalized to pH 7.4 and fitted to a single-binding-site model. pKa of 7.4 ± 0.1 and I max of 196.3 ± 10.5% for WT. pKa of 7.3 ± 0.1 and I max of 174.4 ± 4.0% for LV. C, pH dependence of choline uptake was measured in 10 μm choline (1% [3H]choline) for 30 min (n = 8). pKa of 7.4 ± 0.1 and V max of 188.8 ± 3.7% for WT. pKa of 7.3 ± 0.1 and V max of 167.0 ± 3.8% for LV. D, pH dependence of HC-3-specific binding was measured in 10 nm [3H]HC-3 for 30 min (n = 6–8). pKa of 7.8 ± 0.1 and maximum binding (B max) of 328.0 ± 10.0% for WT. pKa of 7.7 ± 0.2 and B max of 283.6 ± 17.8% for LV.
Figure 8.
Figure 8.
Effect of pH on K m and I max. A, K m and I max for choline-induced currents measured at different pH and held at −60 mV (n = 3). At pH 6.5, K m of 1.9 ± 0.3 μm and I max of −3.8 ± 0.1 nA. At pH 7.4, K m of 0.9 ± 0.3 μm and I max of −21.3 ± 0.4 nA. At pH 8.5, K m of 0.8 ± 0.2 μm and I max of −32.3 ± 0.5 nA. LV-expressing oocytes were used. As a control, three water-injected oocytes were measured at each pH 6.5, 7.4, and 8.5. B, Na+ dependence of choline-induced current at various pH. In 10 μm choline, the induced current was measured at −60 mV, because LiCl replaced NaCl at different pH (n = 3). The Na dependence is linear at all pH. LV-expressing oocytes were used. C, Cl dependence of choline-induced current at various pH (n = 3). In 10 μm choline, the induced current at −60 mV is measured at different pH (Na gluconate replacing NaCl). Results at 6.5 were insufficiently precise, although saturation clearly occurs. K m of 67.2 ± 22.5 mm and I max of −3.8 ± 0.6 nA for pH 6.5. K m of 14.9 ± 3.4 mm and I max of −16.7 ± 0.7 nA for pH 7.4. K m of 12.8 ± 1.7 mm and I max of −25.0 ± 0.5 nA for pH 8.5. LV-expressing oocytes were used. D, Na+ and Cl dependence of the choline-induced current do not depend on pH. Data from B and C are normalized for all pH and averaged. For Cl, K m of 23.6 ± 5.8 mm and I max of 122.2 ± 7.6%. E, Na+ dependence of HC-3 binding (n = 6–8). Na+ dependence of HC-3 binding is similar to that of choline-induced current (D). F, Cl dependence of HC-3 binding (n = 6–8). Cl dependence of HC-3 binding is similar to that of choline-induced current (D). Cl dependence is fitted to a single-binding-site model. K m of 31.2 ± 3.8 mm and B max of 131.0 ± 4.8% for WT. K m of 17.5 ± 20.4 mm and B max of 126.4 ± 30.7% for LV.

Similar articles

Cited by

References

    1. Adams SV, DeFelice LJ. Ionic currents in the human serotonin transporter reveal inconsistencies in the alternating access hypothesis. Biophys J. 2003;85:1548–1559. - PMC - PubMed
    1. Apparsundaram S, Ferguson SM, George AL, Jr, Blakely RD. Molecular cloning of a human, hemicholinium-3-sensitive choline transporter. Biochem Biophys Res Commun. 2000;276:862–867. - PubMed
    1. Apparsundaram S, Ferguson SM, Blakely RD. Molecular cloning and characterization of a murine hemicholinium-3-sensitive choline transporter. Biochem Soc Trans. 2001;29:711–716. - PubMed
    1. Aubrey KR, Mitrovic AD, Vandenberg RJ. Molecular basis for proton regulation of glycine transport by glycine transporter subtype 1b. Mol Pharmacol. 2000;58:129–135. - PubMed
    1. Bales KR, Tzavara ET, Wu S, Wade MR, Bymaster FP, Paul SM, Nomikos GG. Cholinergic dysfunction in a mouse model of Alzheimer disease is reversed by an anti-Aβ antibody. J Clin Invest. 2006;116:825–832. - PMC - PubMed

Publication types

MeSH terms