. 2006 Sep 27;26(39):9881-91.
doi: 10.1523/JNEUROSCI.2246-06.2006.

Identification of a novel oligodendrocyte cell adhesion protein using gene expression profiling

Affiliations

Identification of a novel oligodendrocyte cell adhesion protein using gene expression profiling

Joseph A Nielsen et al. J Neurosci. .

Abstract

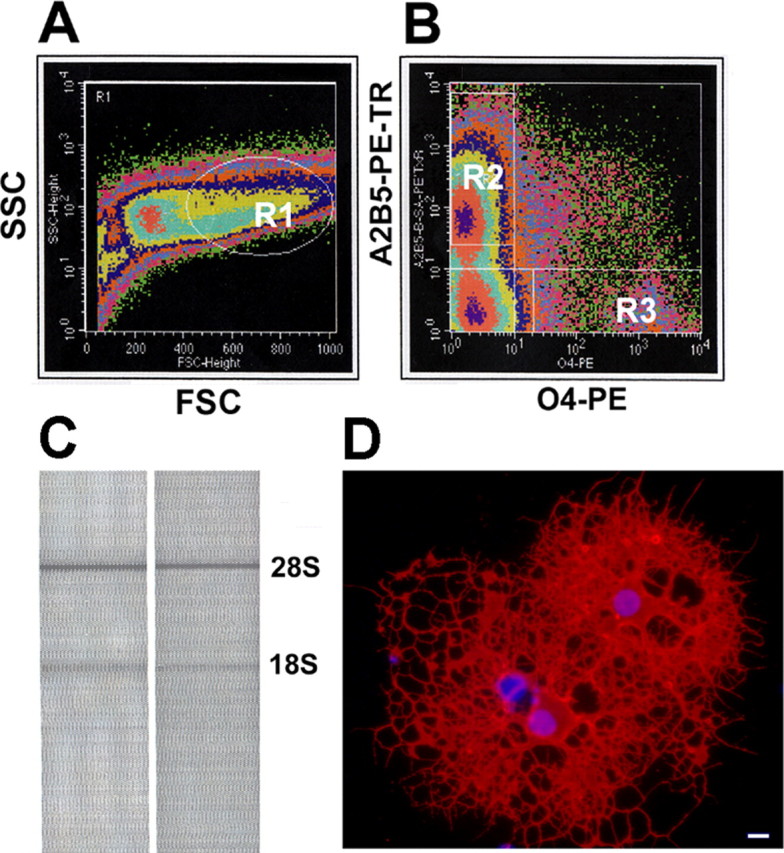
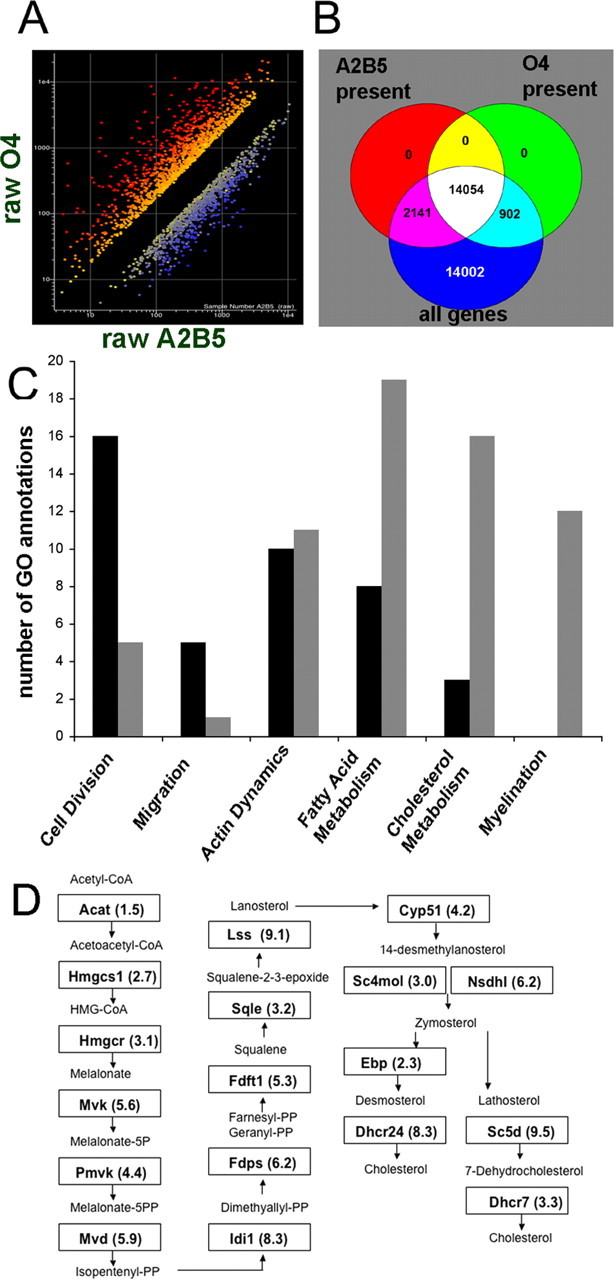
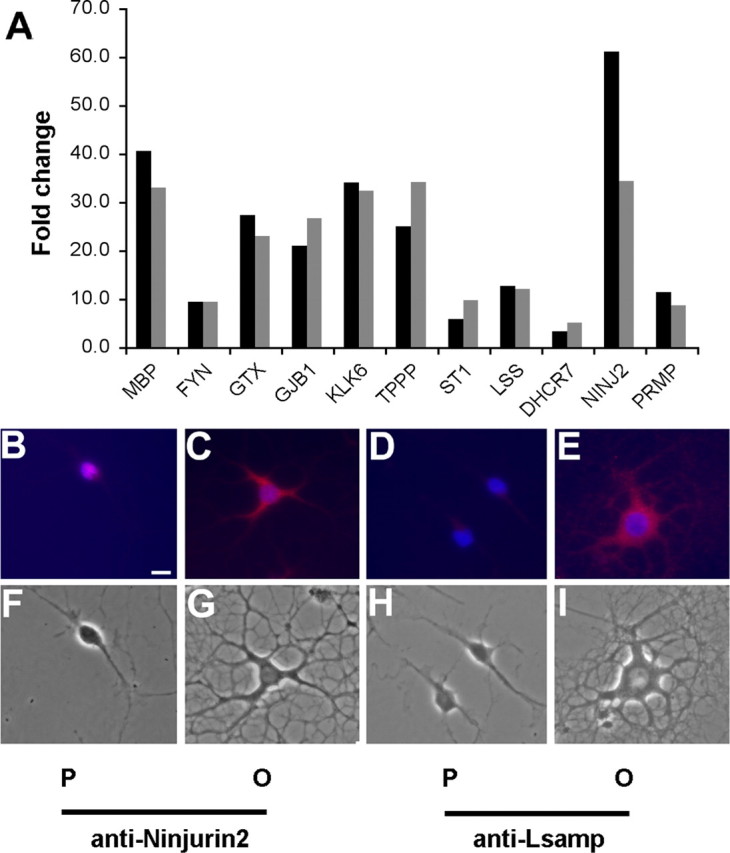
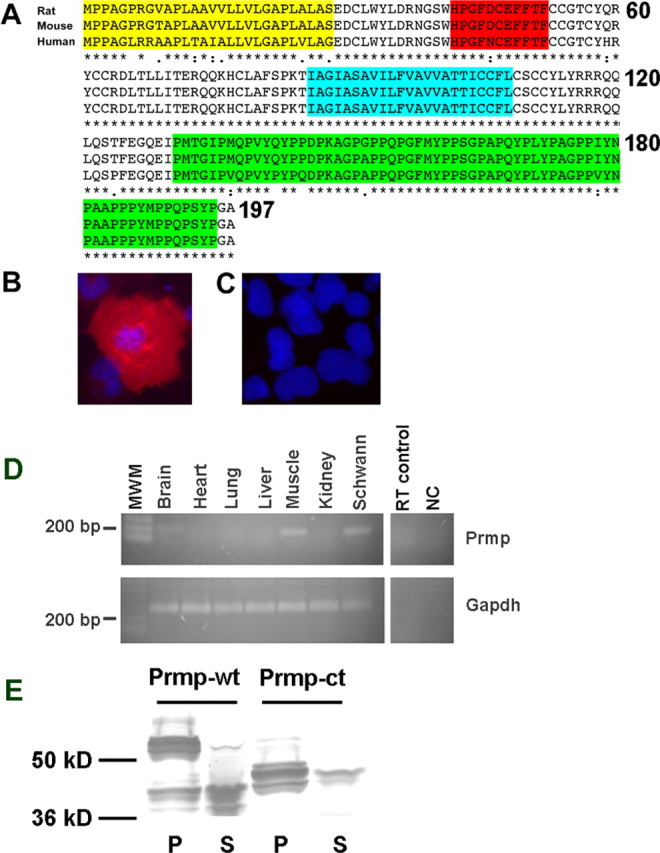
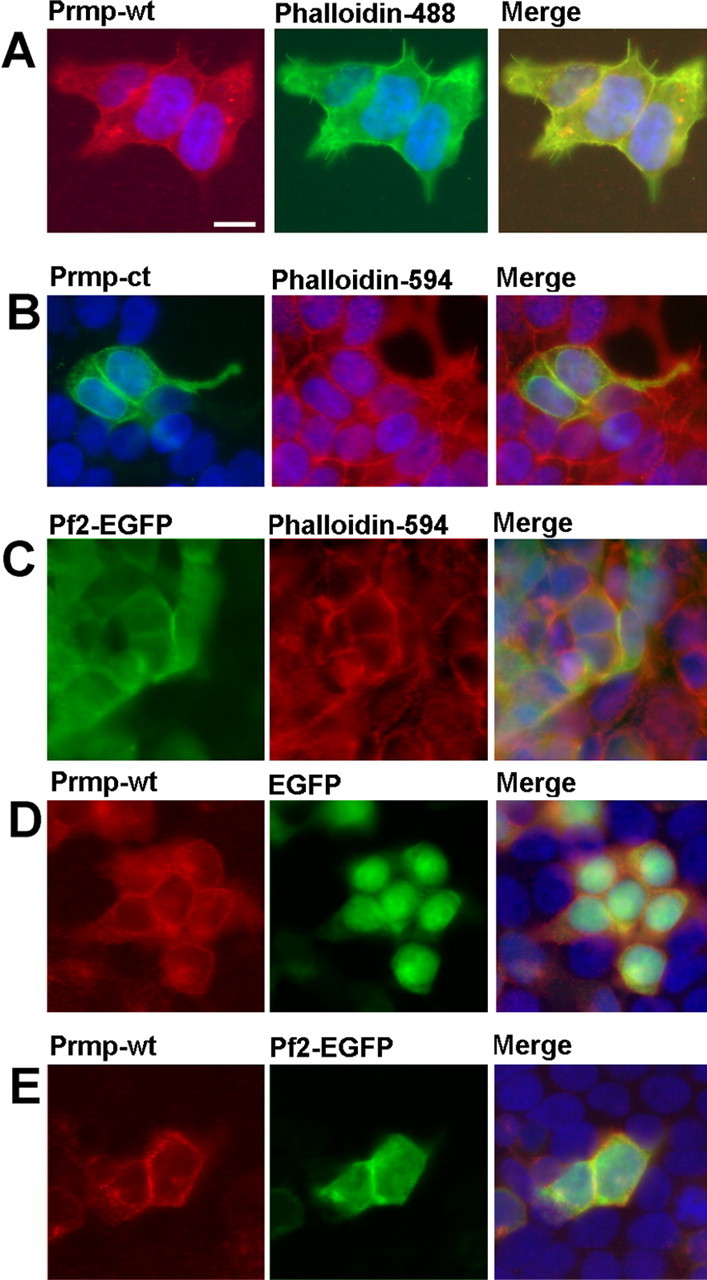
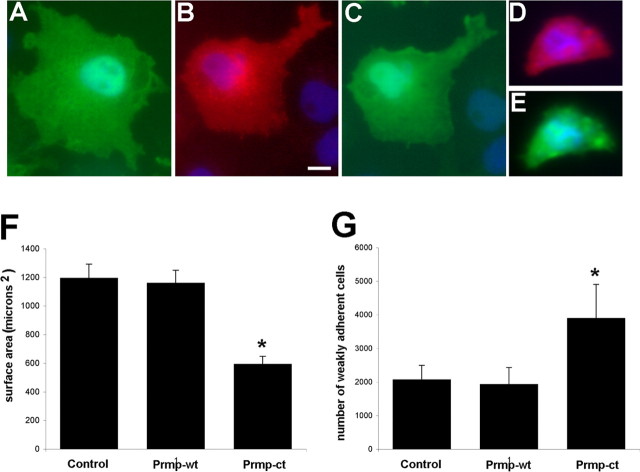
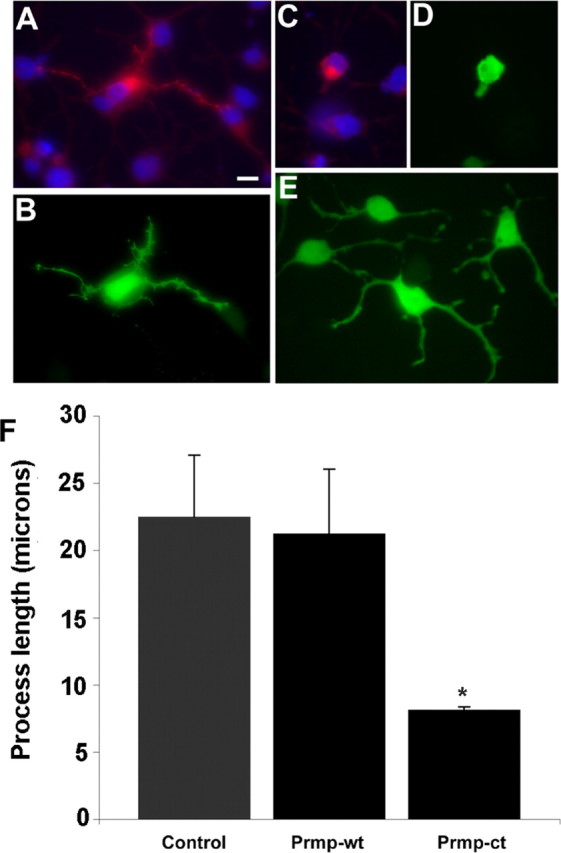
Oligodendrocytes undergo extensive changes as they differentiate from progenitors into myelinating cells. To better understand the molecular mechanisms underlying this transformation, we performed a comparative analysis using gene expression profiling of A2B5+ oligodendrocyte progenitors and O4+ oligodendrocytes. Cells were sort-purified ex vivo from postnatal rat brain using flow cytometry. Using Affymetrix microarrays, 1707 transcripts were identified with a more than twofold increase in expression in O4+ oligodendrocytes. Many genes required for oligodendrocyte differentiation were upregulated in O4+ oligodendrocytes, including numerous genes encoding myelin proteins. Transcriptional changes included genes required for cell adhesion, actin cytoskeleton regulation, and fatty acid and cholesterol biosynthesis. At the O4+ stage, there was an increase in expression of a novel proline-rich transmembrane protein (Prmp). Localized to the plasma membrane, Prmp displays adhesive properties that may be important for linking the extracellular matrix to the actin cytoskeleton. Together, our results highlight the usefulness of this discovery-driven experimental strategy to identify genes relevant to oligodendrocyte differentiation and myelination.


Figures

Figure 1.
Figure 1.
Oligodendrocytes were purified directly from the whole brain of postnatal day 7 rats using flow cytometry. A, FACS density scatter plot in pseudocolor shows forward scatter (FSC) versus side scatter (SSC) properties used to identify viable cells (gate R1). B, A2B5 and O4 immunofluorescence signals were used in combination with gate R1 to sort-purify homogeneous populations of vital cells at early and later stages of oligodendrocyte differentiation. Gates were set to collect single A2B5+ progenitors expressing middle to high levels of A2B5 (top left quadrant, R2) and single O4+ oligodendrocytes (bottom right quadrant, R3). C, Agilent Bioanalyzer analysis of total RNA extracted from oligodendrocytes isolated by FACS demonstrates the intact 28S and 18S rRNA bands. D, Sorted A2B5+ cells cultured for 6 d differentiated into mature oligodendrocytes, as evidenced by strong immunoreactivity with the O1 antibody (red fluorescence). Scale bar, 10 μm.
Figure 2.
Figure 2.
Transcripts upregulated in O4+ cells include many genes known to be involved with myelination. A, Microarray expression values from the Affymetrix rat 230 chip. A, Genes upregulated more than twofold in O4+ cells are shown in red, and genes downregulated more than twofold are shown in blue. B, Venn diagram illustrating the number of genes that were called present in four of five A2B5+ replicates and three of four O4+ replicates. C, Affymetrix GO browser was used to assign biological process terms for transcripts that were either downregulated (black bars) or upregulated (gray bars) in O4+ cells for the following GO designations: cell division, 51301; migration, 16477; actin dynamics, 30036; fatty acid metabolism, 6631, 6633, 6635; cholesterol metabolism, 6695, 8203, 45540; myelination, 42552. D, Genes in the cholesterol biosynthesis pathway with the designated gene symbol and fold upregulation in O4+ cells are shown in their respective boxes.
Figure 3.
Figure 3.
Transcripts identified as differentially regulated by microarray analysis were validated by qRT-PCR and immunocytochemistry. A, Relative qRT-PCR (gray bars) was performed on RNA isolated by FACS, and compared with the data obtained with microarrays (black bars). Summary of qRT-PCR data on 11 transcripts including several genes known to be upregulated during oligodendrocyte differentiation (Mbp, Fyn, Nkx6.2, and Gjb1) and transcripts involved with cholesterol biosynthesis including Osc and Dhcr7. B–I, Immunocytochemistry using anti-Ninjurin2 (B, C, F, G) and Lsamp (D, E, H, I) was used to validate the array data at the protein level. Primary oligodendrocyte cultures were grown in the presence of PDGF and bFGF to maintain their immature progenitor state (P) (B, D) or in the absence of these growth factors to allow differentiation into oligodendrocytes (O) (C, E). Strong signal was detected in the cell body and processes of differentiated oligodendrocytes incubated with anti-Ninjurin2 (C, G), whereas little Ninjurin2 staining was observed in oligodendrocyte progenitors (B, F). Strong signal was also detected in the cell body and processes of differentiated oligodendrocytes incubated with anti-Lsamp (E, I), whereas little signal was observed in oligodendrocyte progenitors (D, H). DAPI staining of nuclei is blue. Scale bar, 10 μm.
Figure 4.
Figure 4.
Prmp is a highly conserved detergent-insoluble transmembrane protein. A, Amino acid alignment of rat, mouse, and human orthologs of Prmp. Prmp is a predicted single pass transmembrane protein with an N-terminal extracellular domain containing a predicted signal peptide (yellow) and a region of homology with E-cadherin (red). The predicted transmembrane domain is highlighted in blue. The C terminus contains a proline-rich domain highlighted in green. COS7 cells transfected with C-terminal Myc-tagged Prmp were fixed and permeabilized (B) or surface-stained live with anti-Myc (C). C-terminally tagged Prmp was only detected after permeabilization. DAPI staining of nuclei is blue. D, RT-PCR was performed on various adult mouse tissues. Prmp was detected in the brain, skeletal muscle, and Schwann cells. MWM, Molecular weight marker; NC, negative control; RT, no reverse transcriptase control. E, HEK293 cells were transfected with an EGFP-tagged Prmp expression vector, and 24 h after transfection, lysates were prepared with a 1% Triton X-100 extraction buffer at 4°C. Both the full-length Prmp-wt and Prmp-ct deletion mutant were found predominantly in the detergent-insoluble fraction (P). Only a small percentage of the transfected full-length Prmp-wt or Prmp-ct was recovered in the detergent-soluble fraction (S).
Figure 5.
Figure 5.
Prmp is localized to the plasma membrane in HEK293 cells, and colocalizes with actin and Profilin2. A, Myc-tagged Prmp-wt was transfected into HEK293 cells. At 24 h after transfection, the cells were fixed and detected with anti-Myc (red) and phalloidin 488 (green). B, EGFP-tagged Prmp-ct was transfected into HEK293 cells and detected with anti-EGFP (green) and phalloidin 594 (red). C, An EGFP-tagged Profilin2 was transfected into HEK293 cells and detected with anti-EGFP (green) and phalloidin-594 (red). D, Control EGFP transfected HEK293 cells demonstrate little colocalization of Prmp and EGFP. E, Prmp tagged with Myc was cotransfected with Profilin2 tagged with EGFP, and detected with anti-Myc (red) and anti-EGFP (green). Prmp and Profilin2 appear to colocalize at cell–cell junctions. DAPI staining of nuclei is blue. Scale bar, 10 μm.
Figure 6.
Figure 6.
Deletion of the C terminus of Prmp reduces membrane spreading of COS7 cells. A, COS7 cells were transfected with control EGFP and detected with anti-EGFP. The EGFP channel was used to measure membrane spreading. COS7 cells were cotransfected with Prmp-wt (red; B), and EGFP (green; C). COS7 cells were cotransfected with a C-terminal deletion mutant (Prmp-ct; D) and (EGFP; E). The corresponding EGFP channel in E demonstrates the reduced size of COS7 cells that have been transfected with Prmp-ct. DAPI staining of nuclei is blue. Scale bar, 10 μm. F, Quantitation of Prmp transfection in COS7 cells. The total area was measured using the EGFP channel and IPLab software. Fifty cells from two independent experiments were measured for each group. Error bar represents SEM. *p < 0.01, Student's t test (Prmp-wt compared with Prmp-ct). G, Cell adhesion assays were performed on HEK293 cells transfected with EGFP control, Prmp-wt-EGFP, and Prmp-ct-EGFP. Twenty-four hours after transfection, wells were gently washed and loosely adherent cells were counted with hemacytometer. Two wells per condition were counted, and five independent replicates were performed. Error bars represent the SEM. *p < 0.05, Student's t test (Prmp-wt compared with Prmp-ct).
Figure 7.
Figure 7.
Deletion of Prmp C terminus reduces process length of CG4 cells. CG4 cells were transfected with an expression vector containing Prmp tagged with Myc (A). Cotransfection with EGFP was used to measure the length of the longest process (B). A C-terminal deletion mutant (Prmp-ct) was transfected into CG4 cells (C). The corresponding EGFP channel in C demonstrates the severe reduction in process length of CG4 cells that have been transfected with Prmp-ct (D). E, Control EGFP transfected CG4 cells. DAPI staining of nuclei is blue. Scale bar, 10 μm. F, Quantitation of process length after Prmp transfection in CG4 cells. The longest process was measured from the cell body to the end of the process using the EGFP channel and IPLab software. Fifty cells from two independent experiments were measured for each group. Error bars represent SEM. *p < 0.01, Student's t test (Prmp-wt compared with Prmp-ct).

Similar articles

Cited by

References

    1. Abney ER, Williams BP, Raff MC. Tracing the development of oligodendrocytes from precursor cells using monoclonal antibodies, fluorescence-activated cell sorting, and cell culture. Dev Biol. 1983;100:66–171. - PubMed
    1. Araki T, Milbrandt J. Ninjurin2, a novel homophilic adhesion molecule, is expressed in mature sensory and enteric neurons and promotes neurite outgrowth. J Neurosci. 2000;20:187–195. - PMC - PubMed
    1. Armstrong RC. Isolation and characterization of immature oligodendrocyte lineage cells. Methods. 1998;16:282–292. - PubMed
    1. Asou H, Hamada K, Miyazaki T, Sakota T, Hayashi K, Takeda Y, Marret S, Delpech B, Itoh K, Uyemura K. CNS myelinogenesis in vitro: time course and pattern of rat oligodendrocyte development. J Neurosci Res. 1995;40:519–534. - PubMed
    1. Barrett T, Suzek TO, Troup DB, Wilhite SE, Ngau WC, Ledoux P, Rudnev D, Lash AE, Fujibuchi W, Edgar R. NCBI GEO: mining millions of expression profiles—database and tools. Nucleic Acids Res. 2005;33:D562–D566. - PMC - PubMed

Publication types

MeSH terms