. 2006 Sep 27;26(39):9935-43.
doi: 10.1523/JNEUROSCI.0958-06.2006.

Local interneurons regulate synaptic strength by retrograde release of endocannabinoids

Affiliations

Local interneurons regulate synaptic strength by retrograde release of endocannabinoids

Michael Beierlein et al. J Neurosci. .

Abstract

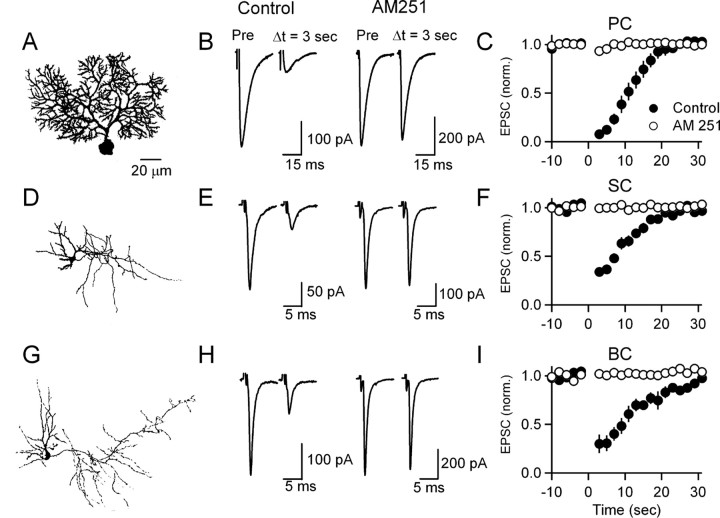
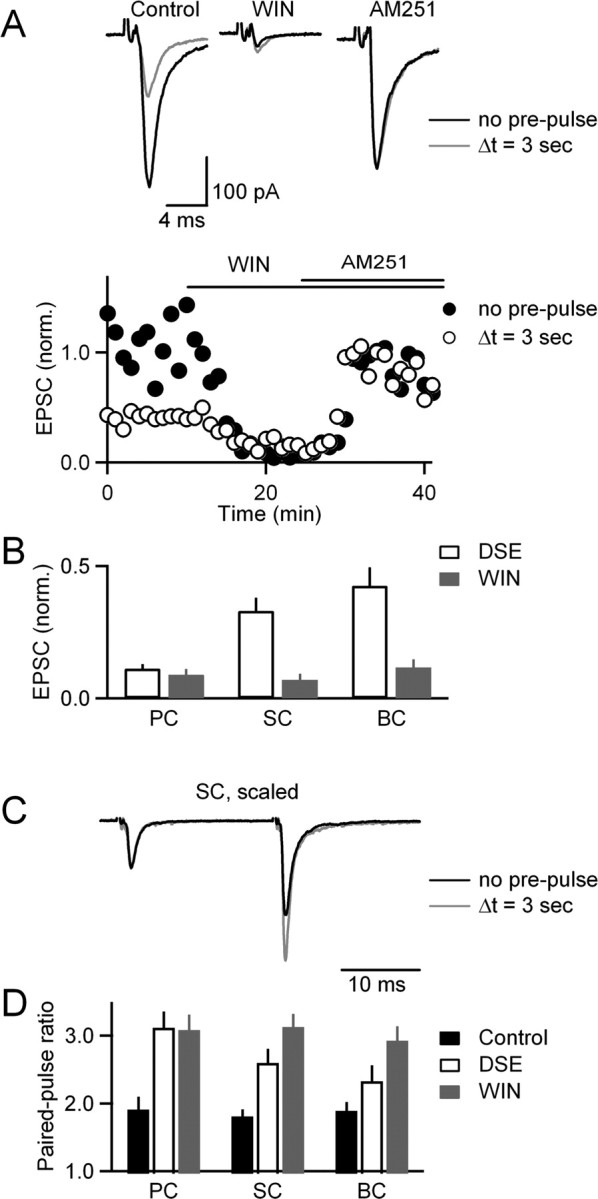
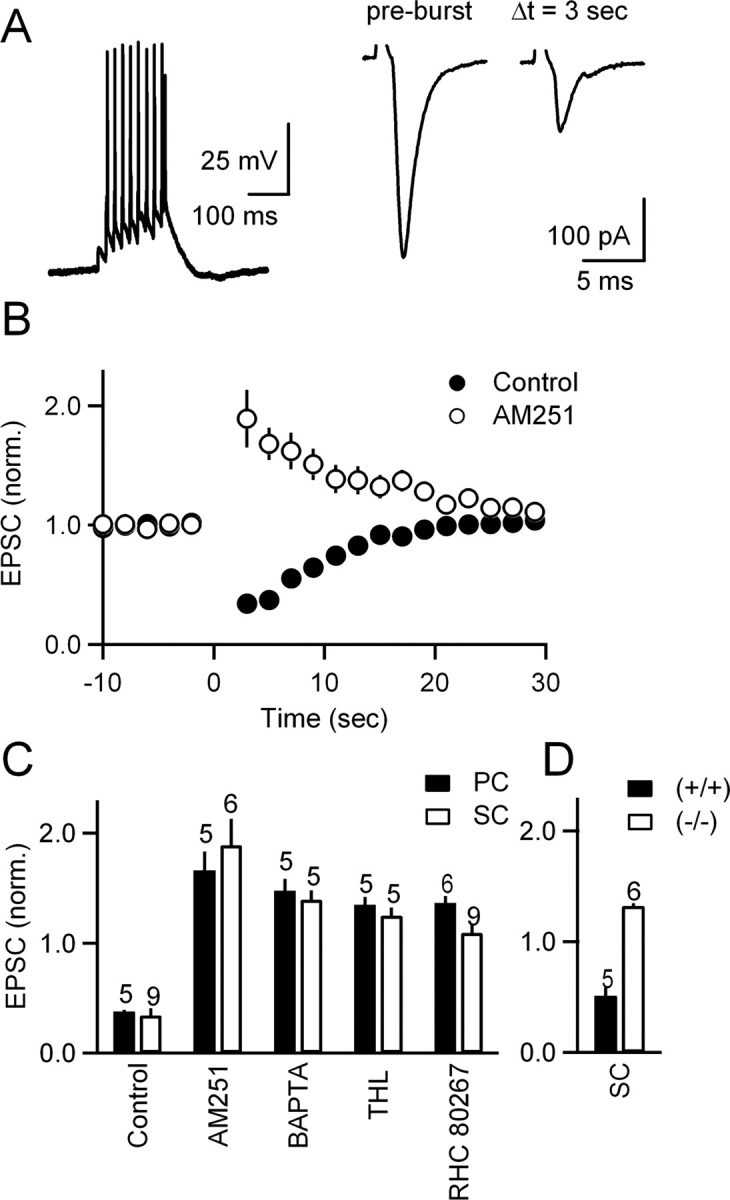
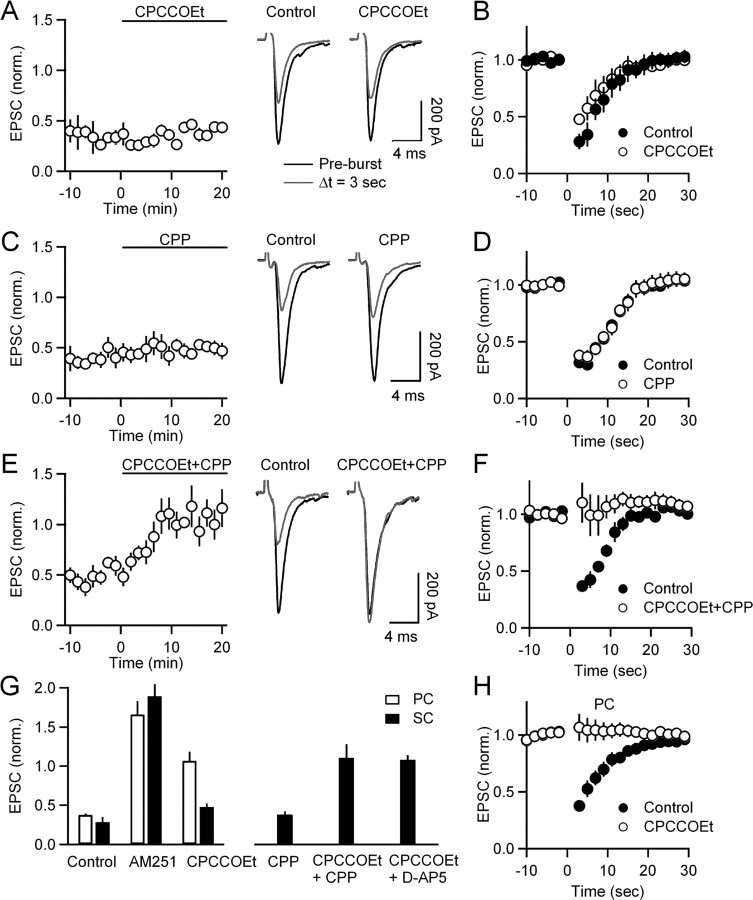
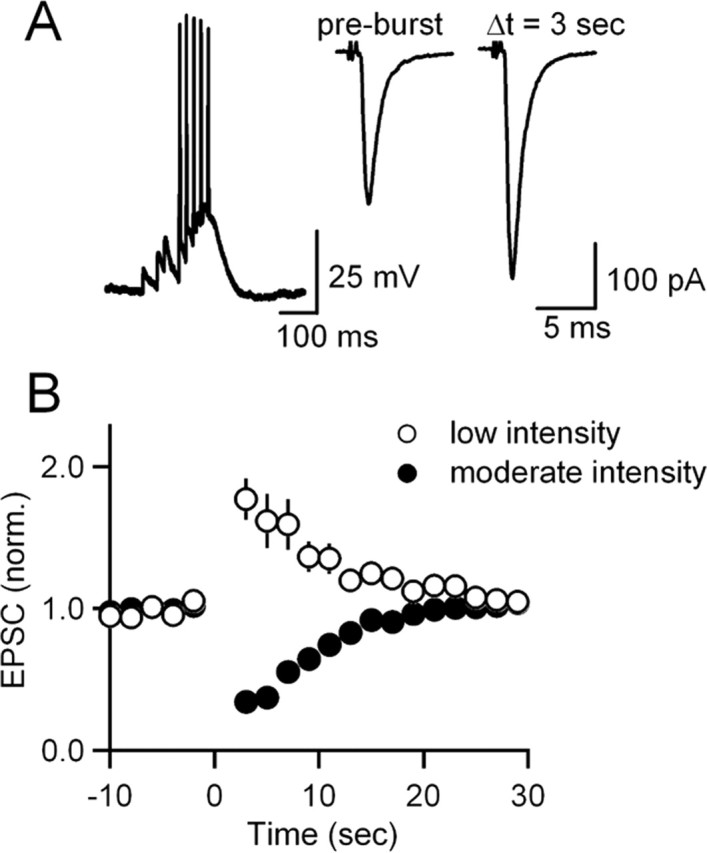
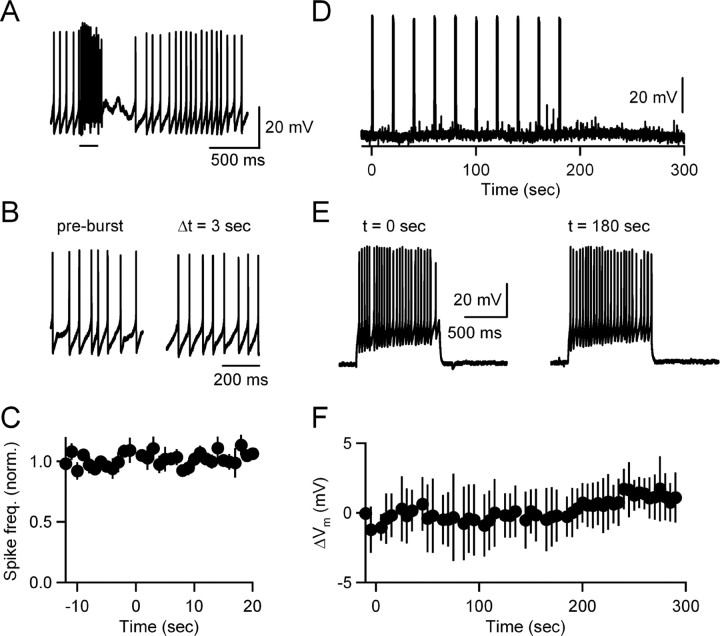
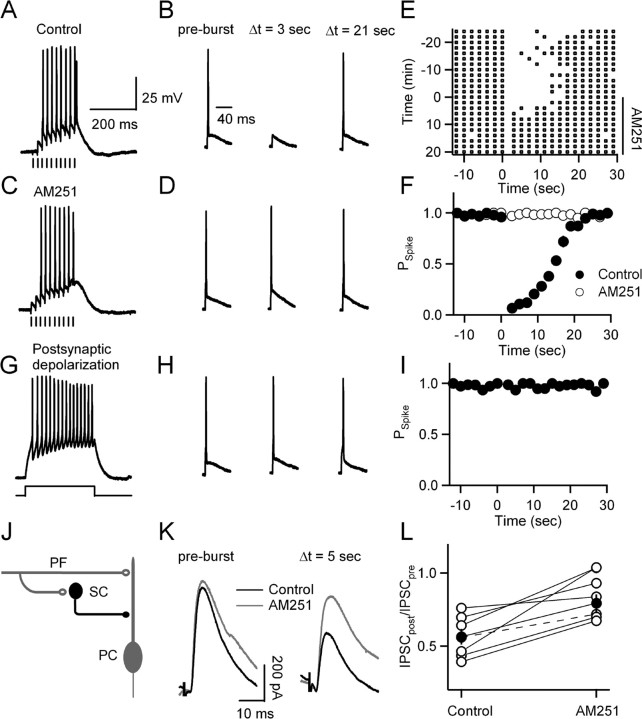
Neurons release endocannabinoids from their dendrites to trigger changes in the probability of transmitter release. Although such retrograde signaling has been described for principal neurons, such as hippocampal pyramidal cells and cerebellar Purkinje cells (PCs), it has not been demonstrated for local interneurons. Here we tested whether inhibitory interneurons in the cerebellum, stellate cells (SCs) and basket cells, regulate the strength of parallel fiber (PF) synapses by releasing endocannabinoids. We found that depolarization-induced suppression of excitation (DSE) is present in both SCs and basket cells. The properties of retrograde inhibition were examined more thoroughly for SCs. Both DSE and synaptically evoked suppression of excitation (SSE) triggered with brief PF bursts require elevations of postsynaptic calcium, are blocked by a type 1 cannabinoid receptor (CB1R) antagonist, and are absent in mice lacking the CB1R. SSE for SCs is similar to that described previously for PCs in that it is prevented by BAPTA and DAG lipase inhibitors in the recording pipette; however, unlike in PCs, NMDA receptors (NMDARs) play an important role in SSE for SCs. Although SCs express CB1Rs postsynaptically, neither high-frequency firing of SCs nor PF bursts lead to autocrine suppression of subsequent SC activity. Instead, PF bursts decrease the amplitude of disynaptic inhibition in PCs by evoking endocannabinoid release that transiently reduces the ability of PF synapses to trigger spikes in SCs. Thus, local interneurons within the cerebellum can release endocannabinoids through metabotropic glutamate receptor- and NMDAR-dependent mechanisms and contribute to use-dependent modulation of circuit properties.


Figures

Figure 1.
Figure 1.
Depolarization of SCs and BCs suppresses parallel fiber synapses by activating cannabinoid receptors. A, D, G, Fluorescent images of a PC (A), an SC (D), and a BC (G), obtained with a two-photon laser scanning microscope, are shown. Images have been inverted. PFs were stimulated with an extracellular electrode at 0.5 Hz, and EPSCs were recorded in voltage clamp at a holding potential of −70 mV. At time t = 0, cells were depolarized to 0 mV for 2 s. B, E, H, Average responses of representative experiments are shown before and 3 s after the beginning of the postsynaptic depolarization for control conditions (left) and in the presence of the CB1R antagonist AM251 (2 μm) (right) for PCs (B), SCs (E), and BCs (H). C, F, I, Summaries of the DSE time course are shown for control conditions (black symbols) and in the presence of AM251 (open symbols) for PCs (C), SCs (F), and BCs (I). Pre, Pre-pulse; norm., normalized.
Figure 2.
Figure 2.
Properties of DSE at synapses onto cerebellar interneurons. PFs were activated with paired pulses (50 ms interpulse interval) 17 s before and 3 s after the postsynaptic cell was depolarized to 0 mV for 2 s. The CB1R agonist WIN 55,212-2 (2 μm) was bath applied, followed by the CB1R antagonist AM251 (5 μm). Experiments were performed in 4 mm calcium. Effects on EPSC amplitude are shown in A and B, and changes in paired-pulse ratio are shown in C and D. A, A representative experiment is shown for PF to SC synapses; the average response before (black) and 3 s after (gray) depolarization is plotted for each condition (top), and the normalized EPSC amplitude is plotted as a function of time (bottom). B, Experiments as in A are summarized to compare the effects of depolarizing the postsynaptic cell in control conditions with the effects of WIN 55,212-2 on the magnitude of the EPSC for the various types of PF synapses. C, Representative average responses are shown for PF to SC synapses before depolarization (black traces) and 3 s after depolarization (gray traces). Responses are normalized to the first EPSC to allow comparison of the extent of facilitation before and after depolarization (the amplitudes of EPSC1 before and after depolarization were 350 and 120 pA, respectively). D, Summary of the change of facilitation induced by depolarization, with the average paired-pulse ratio (PPR = EPSC2/EPSC1) in control conditions before depolarization (black bars), after depolarization in control conditions (white bars), and in the presence of WIN 55,212-2 (gray bars). WIN, WIN 55,212-2; norm., normalized.
Figure 3.
Figure 3.
Synaptically evoked retrograde inhibition in SCs. Experiments were performed with a K-based internal solution. PF EPSCs were evoked at 0.5 Hz. At time t = 0, PF EPSPs were evoked with 10 stimuli at 50 Hz in current clamp. Recordings were then returned to voltage clamp, and EPSCs were evoked with 0.5 Hz stimulation. A, SSE in a representative experiment, with the response evoked by the conditioning train (left) and the average synaptic response recorded before and after the conditioning train (right). B, Time course of SSE in control conditions and in the presence of AM251. C, SSE (measured as EPSC amplitude at Δt = 3 s, normalized to EPSC before burst) in PCs and SCs recorded in control conditions, in the presence of AM251 in the bath, in the presence of the calcium buffer BAPTA (20 mm) in the recording pipette, in the presence of the DAG lipase inhibitor THL (2 μm) in the pipette, and in the presence of the DAG lipase inhibitor RHC 80267 (30 μm) in the bath. The number of experiments is indicated. All treatments led to a significant reduction of SSE for both SCs and PCs (p < 0.01; unpaired Student's t test). D, SSE at the PF to SC synapse in CB1R knock-out mice was significantly reduced compared with SSE at synapses in wild-type littermates (p < 0.01; unpaired Student's t test). norm., Normalized.
Figure 4.
Figure 4.
NMDARs mediate SSE in SCs. SSE was assessed after bath application of the mGluR1 antagonist CPCCOEt (A, B), the NMDAR antagonist CPP (C, D), and coapplication of CPCCOEt and CPP (E, F). A, C, E, The extent of SSE for five to seven experiments in each condition is summarized during bath application of drugs (left); average synaptic currents from representative experiments are shown in control conditions and in the presence of antagonists (right). B, D, F, Summary of the effects of CPCCOEt (B), CPP (D), and CPCCOEt plus CPP (F) on the time course of SSE in SCs. G, Summary of the average SSE after conditioning trains (normalized to baseline) in PCs and SCs for control conditions, in the presence of 2 μm AM251, 100 μm CPCCOEt, 5 μm CPP, and after coapplication of CPCCOEt and CPP and CPCCOEt and 50 μm D-AP5. CPCCOEt application led to a statistically significant difference in SSE between SCs and PCs (p < 0.01; unpaired Student's t test). SSE was significantly reduced in SCs after the coapplication of CPCCOEt and CPP and CPCCOEt and D-AP5 (p < 0.01; paired Student's t test). H, Summary of the effects of CPCCOEt on SSE in PCs. norm., Normalized.
Figure 5.
Figure 5.
Low-intensity PF stimulation does not evoke SSE. A, Representative experiment, with the average response evoked by the conditioning train (left) and the average synaptic response recorded before and after the conditioning train (right). B, Time course of synaptic enhancement after low-intensity stimulation (open circles). Time course of SSE after moderate intensity stimulation (closed circles; data are from Fig. 3B) is shown for comparison. norm., Normalized.
Figure 6.
Figure 6.
Endocannabinoids do not mediate autoinhibition in SCs. A–C, SCs were allowed to fire spontaneously, and the effect of synaptic activation (10 stimuli at 50 Hz) on firing frequency was assessed. A, Representative experiment showing PF bursts evoked during spontaneous activity. The bar underneath the trace indicates time of stimulation. Pause in firing after the burst was not influenced by AM251 application (n = 3 cells; data not shown). B, Spontaneous firing before (left) and 3 s after (right) conditioning burst. C, Normalized spike frequency (bin size = 1 s) before and after conditioning bursts evoked at t = 0 s; n = 5 cells. Frequency of firing ranged from 5 to 15 spikes/s. D–F, In a second set of experiments, SCs were hyperpolarized (20–30 pA) to suppress spontaneous firing, and the effects of spike firing evoked by current steps was assessed. D, High-frequency trains of action potentials (20–40 Hz) evoked with 40–60 pA depolarizing pulses of 1 s duration repeated 10 times did not lead to changes in resting membrane potential (Vm) in a representative SC. E, Responses evoked by the 1st and 10th current step in cell shown in D. F, Summary of resting membrane potential after a series of current steps as in D (n = 6 cells). Spike freq., Spike frequency; norm., normalized.
Figure 7.
Figure 7.
Control of SC spiking and disynaptic inhibition by SSE. A–F, PF synapses were activated at 0.5 Hz before and after a brief PF burst (10 stimuli; 50 Hz) at t = 0 s. Trials were repeated every 2 min, and 2 μm AM251 was bath applied. The resting potential was maintained at −70 mV to suppress spontaneous firing. Stimulus durations for conditioning bursts were lower (150 μs) than for low-frequency stimuli (200 μs). A, C, Typical SC responses are shown for a representative experiment evoked by the burst in control conditions (A) and in the presence of AM251 (C). B, D, The response to a single PF activation is shown before the burst and 3 and 21 s after the burst in control conditions (B) and in the presence of AM251 (D). E, The SC firing for this experiment is shown in a raster plot, with AM251 applied in the bath at time t = 0 min (vertical axis). Squares indicate individual action potentials. Conditioning bursts were applied at time t = 0 s (horizontal axis). F, The probability of PF inputs evoking a spike in an SC as in A–E, before and after a conditioning burst applied at t = 0 (n = 5). G–I, Experiments as in A–F, but at t = 0 s, postsynaptic spike trains were evoked with depolarizing steps (300 ms; 20–30 pA) rather than with PF bursts. G, The responses to depolarization (H) and to PF stimulation at different time points are shown for a representative experiment. I, The probability of PF activation evoking a spike in an SC as in G and H; n = 5. J–L, SSE controls feedforward inhibition. J, Schematic of feedforward inhibitory circuitry. K, Disynaptic IPSCs recorded in PCs in voltage clamp, at a holding potential of 0 mV. Responses were evoked before (IPSCpre) and 5 s after (IPSCpost) a brief burst of 10 PF stimuli (50 Hz), under control conditions (black traces) and after application of AM251 (gray traces). L, Summary of IPSCpost/IPSCpre ratios in control conditions and in the presence of AM251 (open circles; n = 7 cells). Closed circles indicate average, and dashed line indicates cell shown in K. Pspike, Spike probability.

Comment in

References

    1. Bacci A, Huguenard JR, Prince DA. Long-lasting self-inhibition of neocortical interneurons mediated by endocannabinoids. Nature. 2004;431:312–316. - PubMed
    1. Beierlein M, Regehr WG. Brief bursts of parallel fiber activity trigger calcium signals in Bergmann glia. J Neurosci. 2006;26:6958–6967. - PMC - PubMed
    1. Bisogno T, Howell F, Williams G, Minassi A, Cascio MG, Ligresti A, Matias I, Schiano-Moriello A, Paul P, Williams EJ, Gangadharan U, Hobbs C, Di Marzo V, Doherty P. Cloning of the first sn1-DAG lipases points to the spatial and temporal regulation of endocannabinoid signaling in the brain. J Cell Biol. 2003;163:463–468. - PMC - PubMed
    1. Bisogno T, Ligresti A, Di Marzo V. The endocannabinoid signaling system: biochemical aspects. Pharmacol Biochem Behav. 2005;81:224–238. - PubMed
    1. Blitz DM, Regehr WG. Timing and specificity of feed-forward inhibition within the LGN. Neuron. 2005;45:917–928. - PubMed

Publication types

MeSH terms

LinkOut - more resources