. 2006 Sep 27;26(39):9956-66.
doi: 10.1523/JNEUROSCI.0468-06.2006.

Global transcriptome analysis of genetically identified neurons in the adult cortex

Affiliations

Global transcriptome analysis of genetically identified neurons in the adult cortex

Moritz J Rossner et al. J Neurosci. .

Abstract

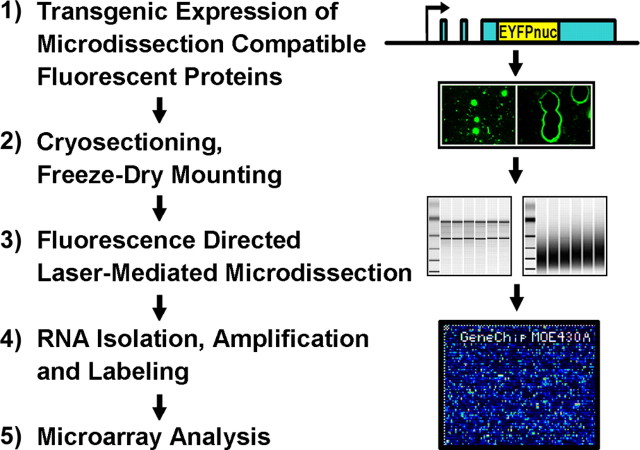
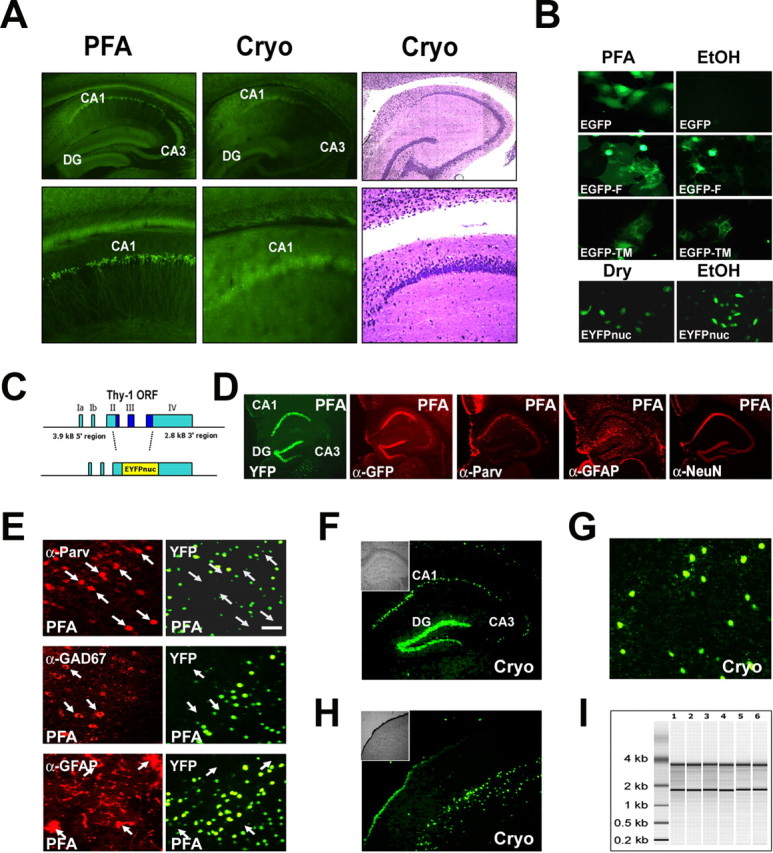
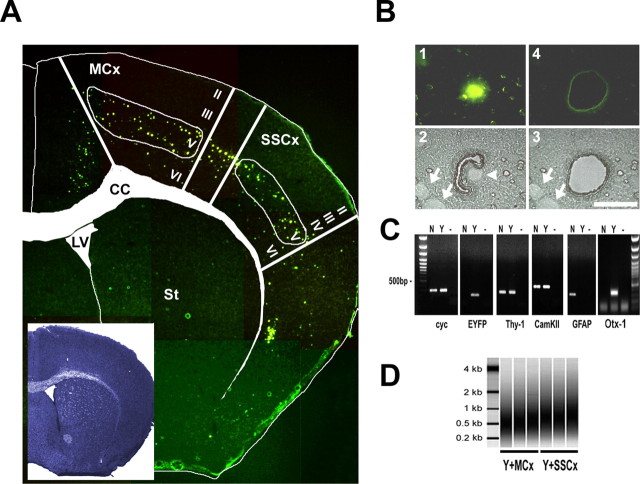
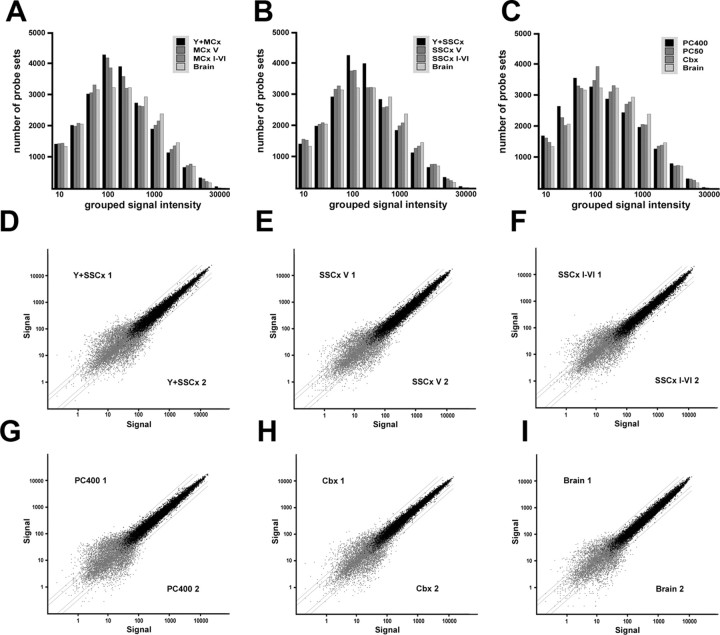
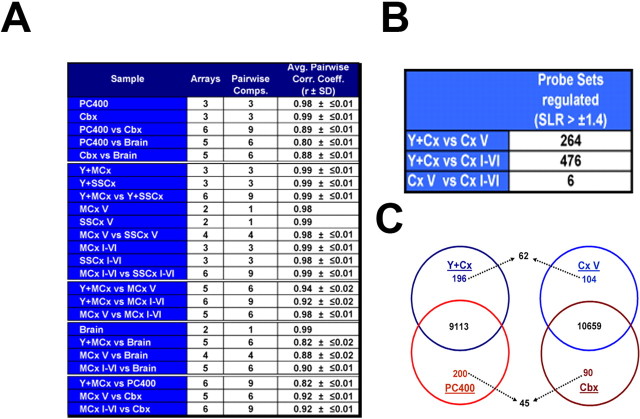
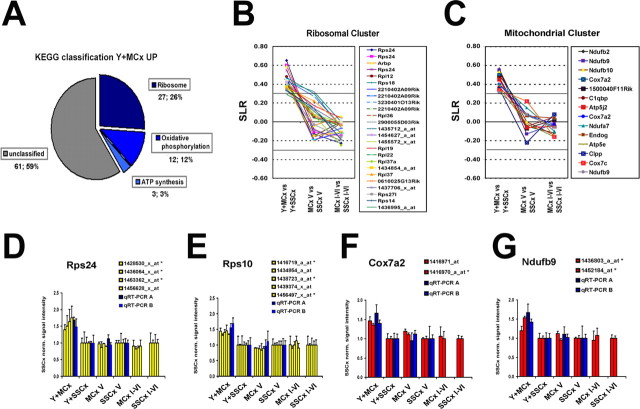
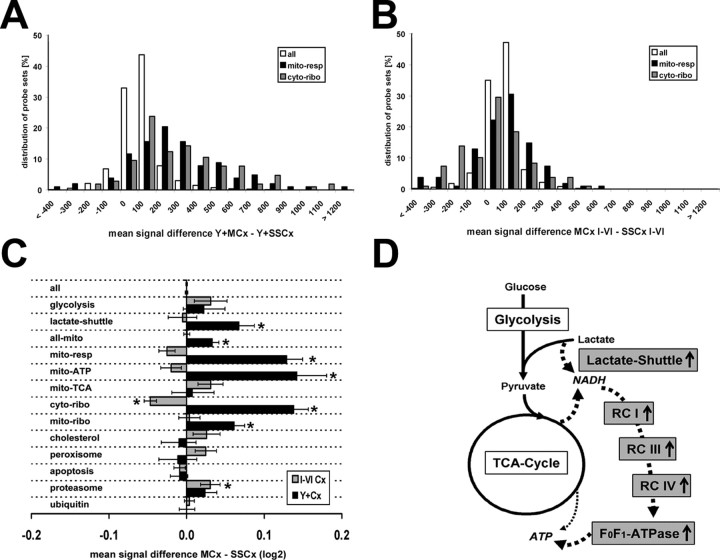
The enormous cellular complexity of the brain is a major obstacle for gene expression profiling of neurological disease models, because physiologically relevant changes of transcription in a specific neuronal subset are likely to be lost in the presence of other neurons and glia. We solved this problem in transgenic mice by labeling genetically defined cells with a nuclear variant of GFP. When combined with laser-directed microdissection, intact RNA from unfixed, freeze-dried sections can be isolated, which is a prerequisite for high-quality global transcriptome analysis. Here, we compared gene expression profiles between pyramidal motor neurons and pyramidal somatosensory neurons captured from layer V of the adult neocortex. One striking feature of motor neurons is the elevated expression of ribosomal genes and genes involved in ATP synthesis. This suggests a molecular adaptation of the upper motor neurons to longer axonal projections and higher electrical activity. These molecular signatures were not detected when cortical layers and microareas were analyzed in toto. Additionally, we used microarrays to determine the global mRNA expression profiles of microdissected Purkinje cells and cellularly complex cerebellar cortex microregions. In summary, our analysis shows that cellularly complex targets lead to averaged gene expression profiles that lack substantial amounts of cell type-specific information. Thus, cell type-restricted sampling strategies are mandatory in the CNS. The combined use of a genetic label with laser-microdissection offers an unbiased approach to map patterns of gene expression onto practically any cell type of the brain.


Figures

Figure 1.
Figure 1.
Experimental strategy to monitor global gene expression patterns of defined neuronal cells. 1, The isolation of defined neuronal cell types with laser-mediated microdissection is based on the transgenic expression of fluorescent proteins that are compatible with the tissue-sectioning procedures indispensable for the isolation of intact RNA. The use of characterized promoters allows for the genetic labeling of cell types of choice. With this approach, no additional staining procedure is needed. 2, In freeze-dried cryosections, the fluorescent labeling as well as cellular RNAs are conserved for long periods of time. 3, The fluorescent label directs the precise isolation of defined cells with an appropriately equipped laser microdissection microscope. 4, High-quality RNA can be extracted, amplified, and labeled to obtain sufficient material to (5) snapshot the transcriptome of defined cells with high-density microarrays or related methods.
Figure 2.
Figure 2.
Conventional GFP derivatives are not compatible with laser-directed microdissection. The cellular signal of a nuclear-targeted EYFP (EYFPnuc) is preserved in freeze-dried cryosections obtained from transgenic mice. RNA isolated from cryosections is intact. A, The cellular resolution of EYFP expressed in transgenic mice is lost after cryosectioning. Sagittal sections of mouse brains from mice expressing cytoplasmic localized EYFP under the control of the Thy-1 promoter were either fixed with 4% buffered PFA or immediately frozen on dry ice. Vibratome sections (PFA, left) obtained from PFA fixed tissue (30 μm) and cryosections (15 μm; Cryo, middle) from frozen tissue, were analyzed for EYFP fluorescence. After cryosectioning, the cellular resolution of the EYFP fluorescent signal is lost. The EYFP signal is retained but appears to be diffuse and faded. Staining of the cryosection with thionin (Cryo, right) reveals that the cellular integrity of the tissue specimen is intact. B, Nuclear targeted fluorescent proteins appear to be promising candidates for a combined in vivo labeling and microdissection approach. COS7 or HeLa cells were transiently transfected with expression constructs coding for GFP derivatives localized to different cellular compartments: EGFP (cytoplasmic localization), EGFP carrying a farnesylation signal (EGFP-F, attached to membranes), EGFP fused to the N terminus of a synthetic transmembrane protein (TM-EGFP), and EYFP fused to three nuclear localization signals (EYFPnuc). Forty-eight hours after transfection, COS7 cells were either fixed with a PBS-buffered 4% PFA or fixed with 70% ethanol (EtOH) and subsequently dry mounted. HeLa cells transfected with EYFPnuc were either dry mounted (DRY) or fixed with 70% ethanol (EtOH) and subsequently frozen at −80°C before analysis. C, Transgenic mice were generated that express a nuclear-targeted EYFP (EYFPnuc) under control of the Thy-1 Promoter (TYNC mice). The Thy-1 minigene was modified by replacing the Thy-1 ORF with sequences coding for EYFPnuc. D, E, Vibratome sections (30 μm) from brains of PFA-fixed TYNC mice were analyzed for YFP fluorescence and for cellular marker gene expression with immunohistochemistry. D, Within the hippocampus, the YFP expression is most prominent in pyramidal neurons of the CA1 field (CA1) and in the granular cell layer of the dentate gyrus (DG). In the CA3 field (CA3), fewer cells are YFP positive. The YFP fluorescence appears to be strictly overlapping with the indirect GFP immune fluorescence analysis (α-GFP), although it is less sensitive. The pan-neuronal marker NeuN (α-NeuN) colocalizes with the nuclear YFP signal. Staining with GFAP (α-GFAP) and parvalbumin (α-Parv) does not reveal YFP overlapping signals. E, Higher-magnification photographs obtained from vibratome sections at the level of the primary motor and sensory cortex. YFP-positive nuclei (YFP) do not colocalize with the interneuronal marker parvalbumin (α-Parv) and GAD67 (α-GAD67) and also not with the astrocyte marker GFAP (α-GFAP). Arrows mark parvalbumin, GAD67, or GFAP-positive cells stained in red in the left panel. No overlap with YFP fluorescence can be detected in the right panel with arrows pointing to identical positions as in the left panel. Scale bar, 50 μm. F–H, Cryosections (8 μm; Cryo) were mounted on PEN foils (Leica) and analyzed for YFP fluorescence. F, In the hippocampus, YFP-positive nuclei can be detected in the granular cell layer (DG) and in the CA1 field of the pyramidal cell layer (CA1). In the CA3 field (CA3), fewer cells are YFP positive. The inset shows the morphology of the hippocampus in bright field. G, Higher magnification of YFP-positive nuclei in the somatosensory cortex. Scale bar, 50 μm. H, In the cortex, cells located in deeper layers show a nuclear YFP signal. The inset shows the morphology of the section at the level of the somatosensory cortex in bright field. I, Total RNA analyzed with a Bioanalyzer (Agilent); each lane represents half of the RNA isolated from one coronal. brain section. Adjacent 8-μ-thick sections were cryomounted on PEN foil slides, dried, and treated as follows: (1) stored for 2 h at room temperature, (2) stored for 8 h at room temperature, (3) stored for 24 h at room temperature, (4) stored for 48 h at room temperature, (5) frozen at −80°C and then kept at room temperature for 2 h, and (6) microdissected regions pooled from eight sections (total area size isolated comparable with one section). The ratio of the 28S versus the 18S rRNA bands was determined with the Bioanalyzer software and for all samples was 1.3± 0.1. The amount of RNA isolated from one coronal 8 μ brain cryosection was ∼50 ng.
Figure 3.
Figure 3.
Fluorescence-directed laser microdissection enables the isolation of neuronal cell types with high precision. A, Fluorescent micrographs taken from an 8 μm TYNC brain cryosection mounted on a POL foil slide at the level of the striatum (St) (bregma, 1 mm) were manually assembled to an overview picture. The inset shows an adjacent section stained with thionin. For better orientation, the boundaries of the corpus callosum (CC) and of the lateral ventricle (LV) were marked in the thionin section, and the label was transferred to the fluorescent picture. In the cortex, at the level of the primary motor and somatosensory areas (MCx and SSCx), mainly cells of the deeper layers are EYFP positive (layer V and few cells in layer VI). In the upper layers II, III, and IV, a low number of dispersed cells were EYFP positive, usually with a weaker EYFP signal intensity. Samples isolated with laser microdissection were chosen from the primary motor and the somatosensory regions. B, Fluorescence-directed laser microdissection of a single YFP-positive cortical neuron. 1, In the fluorescent mode, a single cell was located and marked by an appropriate painting tool (Leica LDM software); only strong EYFP-positive cells in the plane of section were chosen for isolation. The laser-cutting line was drawn around the nucleus at a distance of half the diameter of the nucleus at the most. 2, The microscope was subsequently switched to bright-field mode; here, the corresponding nucleus is visible as a bright round structure (arrowhead). Cells with other nuclei in close proximity were not isolated. Depicted are two nuclei (arrows) at a distance where contamination was considered to be low. Laser cutting follows a manually or automatically drawn circle; using the 150× objective (Leica), the laser cut is ∼1 μm. 3, 4, A successful cut was controlled in the bright field and fluorescent mode. Scale bar, 20 μm. C, The accuracy of isolation was analyzed by RT-PCR using primers specific for the ubiquitously expressed cyclophilin (cyc), EYFP, the neuronal marker Thy-1, and CamKIIα. Otx-1 was chosen as a marker for cortical layer V projection neurons and GFAP as an astrocytic marker. All primers were located near the 3′ terminus. The cDNA template was generated from one round of linear amplified RNA. Total RNA was isolated from a pool of 100 EYFP-positive (Y) or 100 randomly selected EYFP-negative (N) cells from one TYNC cortex section not restricted to layer V. Lanes labeled with — are controls without cDNA. EYFP and Otx-1 mRNAs were detected in the YFP-positive pool of cells. The mRNA of markers for principal neurons Thy-1 and CamKIIα could be detected in the Y and N pools. GFAP expression was only detected in the EYFP-negative pool, suggesting that the contamination with cell material derived from astrocytes in the EYFP fraction is low. D, Two rounds amplified biotin-labeled RNA analyzed with the Bioanalyzer (Agilent). Shown are three independent samples of pools of 100 EYFP-positive cells isolated from layer V of the motor cortex (Y+MCx) and the somatosensory cortex (SSCx). The relative size distribution range is from 0.2 to >1 kB.
Figure 4.
Figure 4.
The GeneChip performance of amplified targets obtained from neuronal cell types isolated with laser-mediated microdissection compared with control preparations. A–C, Variable bin histogram for the samples isolated from primary motor and somatosensory cortex and cerebellum compared with total brain. The number of probe sets (on the y-axis) was plotted against grouped signal intensities (bins) (on the x-axis). The dynamic range of genes detected at low, middle, or high-expression levels comparing LMD isolated samples with the total brain sample is very similar, a technically introduced bias in the LMD isolated samples is therefore unlikely. D–I, Scatter plots of relative signal intensities of replicate arrays with absent called probe sets (gray dots) and present called probe sets (black dots). All replicate samples show a highly similar dynamic range of signal intensities over three orders of magnitude. The scatter does not increase with single-cell targets. D, Scatter plot of signal intensities of independent replicates of 100 pooled single isolated cells from somatosensory cortex (Y+SSCx 1 vs 2). E, Scatter plot of layer V isolated areas from somatosensory cortex (SSCx V 1 vs 2). F, Scatter plot of cortical layers I-VI isolated from somatosensory cortex (SSCx I-VI 1 vs 2). G, Scatter plot of 400 pooled single isolated Purkinje cells isolated from cerebellum (PC400 1 vs 2). H, Scatter plot of cerebellar cortex samples (Cbx 1 vs 2). I, Scatter plot of signal intensities of independent replicates of total brain targets amplified from 50 ng of input RNA (Brain 1 and 2). All errors are given as SD.
Figure 5.
Figure 5.
Statistical analysis of GeneChip data obtained with amplified targets isolated with laser-mediated microdissection. A, Average pair-wise Pearson's correlation coefficients (r) determined for selected comparisons of GeneChip data obtained from complex and cell type-specific samples. B, Numbers of regulated probe sets comparing EYFP-positive cells from layer V (Y+Cx) and layer V microregions (Cx V) with all layers comprising samples (Cx I-VI). The number of regulated genes was determined with MAS 5.0 with a cutoff at 66% change calls and a SLR of at least ± 1.4. The number of probe sets found to be differentially detected between Y+Cx and CxV (264) increases almost twofold in the more cellularly complex Cx I-VI comparison (476). Comparing both cellularly complex samples (Cx V and Cx I-VI) reveals only six probe sets to be differentially detected at the identical selection cutoff. C, Venn diagrams showing overlapping and differentially expressed mRNAs comparing (I) genetically defined pyramidal neurons from neocortex (Y+Cx) and cerebellar Purkinje cells (PC400) (left) and (II) the corresponding microregions in the cortex (Cx V) and in the cerebellum (Cbx). The number of mRNAs detected in both pyramidal neurons and Purkinje cells is 9113 (40.2% of all probe sets); the number of coexpressed genes in the corresponding microregions (Cx V and Cbx) is 10659 (47.0% of all probe sets). Highly differentially expressed genes were defined by an SLR ≥3.0/less than or equal to −3.0 (i.e., regulated ≥9-fold). The number of these genes is 196 and 200 for singly isolated cells and 104 and 90 for the corresponding microregions. Importantly, when entire microregions were compared, only 62 (of 196) and 45 (of 200) cell type-specific genes were identified, suggesting that the majority of differentially expressed genes remain undetected in cellularly complex samples.
Figure 6.
Figure 6.
The detection of coordinated gene expression changes in closely related neuronal cell populations is lost when comparing the corresponding motor or somatosensory cortical microareas. A, Biochemical pathways (KEGG chart, selected with the DAVID pathfinder tool) plotted for the probe sets found as upregulated in the Y+MCx samples. The cutoff for classification was set at 3. With these parameters, 42 (38%) of the 103 genes found upregulated in Y+MCx could be grouped into three biochemical pathways: (I) ribosomal function (27), (II) oxidative phosphorylation (12) and (III) ATP synthesis (see full data set in the supplemental Table 3, available at www.jneurosci.org as supplemental material). No other functional cluster could be generated for any other comparison at the given cutoff (see full data set in supplemental Table 3, available at www.jneurosci.org as supplemental material). B, C, Plotted are the SLRs for functionally grouped genes with a ribosomal function (b) or with a function in mitochondrial respiration (oxidative phosphorylation and ATP synthesis) (c) for all three MCx versus SSCx comparisons. The solid line at an SLR of 0.3 marks the 95% confidence interval for the average signal intensities obtained for the Cx V and Cx I-VI genechips (Fig. 4B) (see Materials and Methods). The upregulation is restricted to the Y+MCx samples when comparing the single-cell isolates. The higher variability in the SLRs observed in the layer V samples is likely to be attributable to the lower number of replicates in these samples (n = 2). D–G, Plots of the relative signal intensities obtained for all functional probe sets in the genechip analysis and two independent GAPDH normalized qRT-PCR measurements for Rps24 (D), Rps10 (E), Cox7a2 (F), and Ndufb9 (G). All values were normalized with the expression level found in the respective somatosensory sample (set to 1). All error bars are depicted as SD.
Figure 7.
Figure 7.
Coordinated upregulation of genes involved in neuronal ATP synthesis and ribosomal function in layer V projection neurons of the motor cortex. A, B, Histogram of the normalized mean gene expression level differences between Y+MCx and Y+SSCx samples (A) and between the MCx I-VI and SSCx I-VI samples (B) for all probe sets (gray bars), those corresponding to genes with a function in mitochondrial respiration (blue bars), and those corresponding to mRNAs coding for proteins of the cytoplasmic ribosome (red bars). C, Plot of the mean log2 transformed normalized gene expression level differences for all genes or defined groups of genes as indicated (for detailed description of gene sets, see supplemental Tables 4 and 5, available at www.jneurosci.org as supplemental material) showing the overall shift toward either motor or somatosensory cortex-derived samples. Black bars correspond to the Y+ comparisons, and gray bars correspond to the Cx I-VI comparisons; the mean average difference values were normalized to all Y+ and I-VI probe sets, respectively (set to 0). Significantly shifted gene sets are marked by asterisks (Mann–Whitney U and Kolmogorov–Smirnov tests; p < 0.05) (for a detailed description of the pathway sampling and detailed statistical analysis, see supplemental Table 4, available at www.jneurosci.org as supplemental material). D, Schematic drawing of the principal metabolic units involved in neuronal ATP synthesis. The flow chart summarizes the findings from the gene set analysis indicating unregulated and Y+MCx upregulated (gray) functionally grouped genes. The drawing illustrates the “lactate-bypass” hypothesis to fuel directly the respiratory chain complexes (RC I-IV) and oxidative phosphorylation machinery (F0F1-ATPase) with NADH, bypassing the glycolysis and at least partially the TCA cycle.

Similar articles

Cited by

References

    1. Arlotta P, Molyneaux BJ, Chen J, Inoue J, Kominami R, Macklis JD. Neuronal subtype-specific genes that control corticospinal motor neuron development in vivo. Neuron. 2005;45:207–221. - PubMed
    1. Barth AL, Gerkin RC, Dean KL. Alteration of neuronal firing properties after in vivo experience in a FosGFP transgenic mouse. J Neurosci. 2004;24:6466–6475. - PMC - PubMed
    1. Bouzier-Sore AK, Voisin P, Canioni P, Magistretti PJ, Pellerin L. Lactate is a preferential oxidative energy substrate over glucose for neurons in culture. J Cereb Blood Flow Metab. 2003;23:1298–1306. - PubMed
    1. Buchstaller J, Sommer L, Bodmer M, Hoffmann R, Suter U, Mantei N. Efficient isolation and gene expression profiling of small numbers of neural crest stem cells and developing Schwann cells. J Neurosci. 2004;24:2357–2365. - PMC - PubMed
    1. Calabrese V, Scapagnini G, Giuffrida Stella AM, Bates TE, Clark JB. Mitochondrial involvement in brain function and dysfunction: relevance to aging, neurodegenerative disorders and longevity. Neurochem Res. 2001;26:739–764. - PubMed

Publication types

MeSH terms

LinkOut - more resources