Hepatogenic differentiation of human mesenchymal stem cells from adipose tissue in comparison with bone marrow mesenchymal stem cells
- PMID: 17007050
- PMCID: PMC4100665
- DOI: 10.3748/wjg.v12.i36.5834
Hepatogenic differentiation of human mesenchymal stem cells from adipose tissue in comparison with bone marrow mesenchymal stem cells
Abstract
Aim: To investigate and compare the hepatogenic transdifferentiation of adipose tissue-derived stem cells (ADSC) and bone marrow-derived mesenchymal stem cells (BMSC) in vitro. Transdifferentiation of BMSC into hepatic cells in vivo has been described. Adipose tissue represents an accessible source of ADSC, with similar characteristics to BMSC.
Methods: BMSCs were obtained from patients undergoing total hip arthroplasty and ADSC from human adipose tissue obtained from lipectomy. Cells were grown in medium containing 15% human serum. Cultures were serum deprived for 2 d before cultivating under similar pro-hepatogenic conditions to those of liver development using a 2-step protocol with sequential addition of growth factors, cytokines and hormones. Hepatic differentiation was RT-PCR-assessed and liver-marker genes were immunohistochemically analysed.
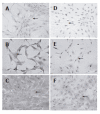
Results: BMSC and ADSC exhibited a fibroblastic morphology that changed to a polygonal shape when cells differentiated. Expression of stem cell marker Thy1 decreased in differentiated ADSC and BMSC. However, the expression of the hepatic markers, albumin and CYPs increased to a similar extent in differentiated BMSC and ADSC. Hepatic gene activation could be attributed to increased liver-enriched transcription factors (C/EBPbeta and HNF4alpha), as demonstrated by adenoviral expression vectors.
Conclusion: Mesenchymal stem cells can be induced to hepatogenic transdifferentiation in vitro. ADSCs have a similar hepatogenic differentiation potential to BMSC, but a longer culture period and higher proliferation capacity. Therefore, adipose tissue may be an ideal source of large amounts of autologous stem cells, and may become an alternative for hepatocyte regeneration, liver cell transplantation or preclinical drug testing.
Figures


Similar articles
-
Sequential hepatogenic transdifferentiation of adipose tissue-derived stem cells: relevance of different extracellular signaling molecules, transcription factors involved, and expression of new key marker genes.Cell Transplant. 2009;18(12):1319-40. doi: 10.3727/096368909X12483162197321. Epub 2009 Aug 5. Cell Transplant. 2009. PMID: 19660180
-
Human mesenchymal stem cells from adipose tissue: Differentiation into hepatic lineage.Toxicol In Vitro. 2007 Mar;21(2):324-9. doi: 10.1016/j.tiv.2006.08.009. Epub 2006 Sep 5. Toxicol In Vitro. 2007. PMID: 17045453
-
Hepatogenic and neurogenic differentiation of bone marrow mesenchymal stem cells from abattoir-derived bovine fetuses.BMC Vet Res. 2014 Jul 10;10:154. doi: 10.1186/1746-6148-10-154. BMC Vet Res. 2014. PMID: 25011474 Free PMC article.
-
Single-Cell Profiles and Clinically Useful Properties of Human Mesenchymal Stem Cells of Adipose and Bone Marrow Origin.Am J Sports Med. 2019 Jun;47(7):1722-1733. doi: 10.1177/0363546519848678. Epub 2019 May 17. Am J Sports Med. 2019. PMID: 31100005 Review.
-
The multiple functional roles of mesenchymal stem cells in participating in treating liver diseases.J Cell Mol Med. 2015 Mar;19(3):511-20. doi: 10.1111/jcmm.12482. Epub 2014 Dec 23. J Cell Mol Med. 2015. PMID: 25534251 Free PMC article. Review.
Cited by
-
Functional 3D human primary hepatocyte spheroids made by co-culturing hepatocytes from partial hepatectomy specimens and human adipose-derived stem cells.PLoS One. 2012;7(12):e50723. doi: 10.1371/journal.pone.0050723. Epub 2012 Dec 7. PLoS One. 2012. PMID: 23236387 Free PMC article.
-
Maintenance of rat hepatocytes under inflammation by coculture with human orbital fat-derived stem cells.Cell Mol Biol Lett. 2012 Jun;17(2):182-95. doi: 10.2478/s11658-012-0004-9. Cell Mol Biol Lett. 2012. PMID: 22287019 Free PMC article.
-
Adipose-derived stem cells for regenerative medicine.Circ Res. 2007 May 11;100(9):1249-60. doi: 10.1161/01.RES.0000265074.83288.09. Circ Res. 2007. PMID: 17495232 Free PMC article. Review.
-
Persistence of a chimerical phenotype after hepatocyte differentiation of human bone marrow mesenchymal stem cells.Cell Prolif. 2008 Feb;41(1):36-58. doi: 10.1111/j.1365-2184.2007.00507.x. Cell Prolif. 2008. PMID: 18211285 Free PMC article.
-
The effects of adipose tissue-derived stem cells seeded onto the curcumin-loaded collagen scaffold in healing of experimentally- induced oral mucosal ulcers in rat.Iran J Basic Med Sci. 2020 Dec;23(12):1618-1627. doi: 10.22038/ijbms.2020.48698.11171. Iran J Basic Med Sci. 2020. PMID: 33489037 Free PMC article.
References
-
- Sakaguchi Y, Sekiya I, Yagishita K, Muneta T. Comparison of human stem cells derived from various mesenchymal tissues: superiority of synovium as a cell source. Arthritis Rheum. 2005;52:2521–2529. - PubMed
-
- Kashofer K, Bonnet D. Gene therapy progress and prospects: stem cell plasticity. Gene Ther. 2005;12:1229–1234. - PubMed
-
- Petersen BE, Bowen WC, Patrene KD, Mars WM, Sullivan AK, Murase N, Boggs SS, Greenberger JS, Goff JP. Bone marrow as a potential source of hepatic oval cells. Science. 1999;284:1168–1170. - PubMed
-
- Fiegel HC, Lioznov MV, Cortes-Dericks L, Lange C, Kluth D, Fehse B, Zander AR. Liver-specific gene expression in cultured human hematopoietic stem cells. Stem Cells. 2003;21:98–104. - PubMed
-
- Lagasse E, Connors H, Al-Dhalimy M, Reitsma M, Dohse M, Osborne L, Wang X, Finegold M, Weissman IL, Grompe M. Purified hematopoietic stem cells can differentiate into hepatocytes in vivo. Nat Med. 2000;6:1229–1234. - PubMed
Publication types
MeSH terms
Substances
LinkOut - more resources
Full Text Sources
Other Literature Sources
Miscellaneous

