

Acute interstitial edematous pancreatitis: Findings on non-enhanced MR imaging
- PMID: 17007053
- PMCID: PMC4100668
- DOI: 10.3748/wjg.v12.i36.5859
Acute interstitial edematous pancreatitis: Findings on non-enhanced MR imaging
Abstract
Aim: To study the appearances of acute interstitial edematous pancreatitis (IEP) on non-enhanced MR imaging.
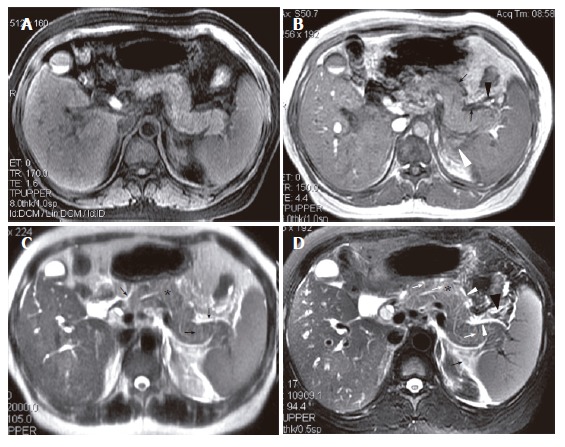
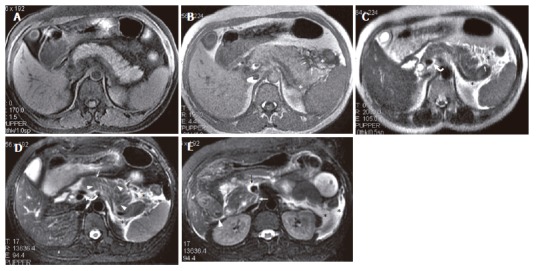
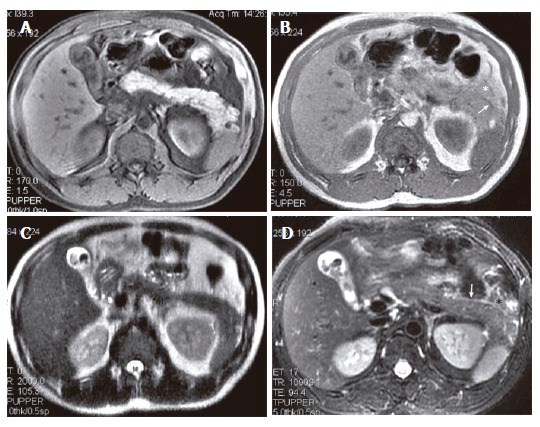
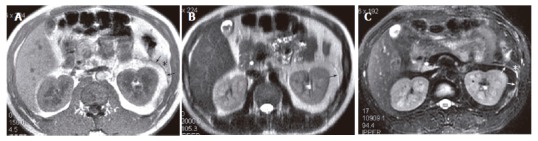
Methods: A total of 53 patients with IEP diagnosed by clinical features and laboratory findings were underwent MR imaging. MR imaging sequences included fast spoiled gradient echo (FSPGR) fat saturation axial T1-weighted imaging, gradient echo T1-weighted (in phase), single shot fast spin echo (SSFSE) T2-weighted, respiratory triggered (R-T) T2-weighted with fat saturation, and MR cholangiopancreatography. Using the MR severity score index, pancreatitis was graded as mild (0-2 points), moderate (3-6 points) and severe (7-10 points).
Results: Among the 53 patients, IEP was graded as mild in 37 patients and as moderate in 16 patients. Forty-seven of 53 (89%) patients had at least one abnormality on MR images. Pancreas was hypointense relative to liver on FSPGR T1-weighted images in 18.9% of patients, and hyperintense in 25% and 30% on SSFSE T2-weighted and R-T T2-weighted images, respectively. The prevalences of the findings of IEP on R-T T2-weighted images were, respectively, 85% for pancreatic fascial plane, 77% for left renal fascial plane, 55% for peripancreatic fat stranding, 42% for right renal fascial plane, 45% for perivascular fluid, 40% for thickened pancreatic lobular septum and 25% for peripancreatic fluid, which were markedly higher than those on in-phase or SSFSE T2-weighted images (P<0.001).
Conclusion: IEP primarily manifests on non-enhanced MR images as thickened pancreatic fascial plane, left renal fascial plane, peripancreatic fat stranding, and peripancreatic fluid. R-T T2-weighted imaging is more sensitive than in-phase and SSFSE T2-weighted imaging for depicting IEP.
Figures
Similar articles
-
Magnetic resonance severity index assessed by T1-weighted imaging for acute pancreatitis: correlation with clinical outcomes and grading of the revised Atlanta classification-a narrative review.Gland Surg. 2020 Dec;9(6):2312-2320. doi: 10.21037/gs-20-554. Gland Surg. 2020. PMID: 33447582 Free PMC article. Review.
-
Stomach diseases: MR evaluation using combined t2-weighted single-shot echo train spin-echo and gadolinium-enhanced spoiled gradient-echo sequences.J Magn Reson Imaging. 1999 Dec;10(6):950-60. doi: 10.1002/(sici)1522-2586(199912)10:6<950::aid-jmri7>3.0.co;2-h. J Magn Reson Imaging. 1999. PMID: 10581508
-
High signal peripancreatic fat on fat-suppressed spoiled gradient echo imaging in acute pancreatitis: preliminary evaluation of the prognostic significance.J Magn Reson Imaging. 2003 Jul;18(1):49-58. doi: 10.1002/jmri.10333. J Magn Reson Imaging. 2003. PMID: 12815639
-
MR imaging of pancreatic changes in patients with transfusion-dependent beta-thalassemia major.AJR Am J Roentgenol. 1999 Jul;173(1):187-92. doi: 10.2214/ajr.173.1.10397124. AJR Am J Roentgenol. 1999. PMID: 10397124
-
[Usefulness of T2-weighted images using single shot fast spin echo (SSFSE) pulse sequence for the evaluation of pancreatobiliary diseases: comparison with MRCP using SSFSE].Nihon Rinsho. 1998 Nov;56(11):2836-41. Nihon Rinsho. 1998. PMID: 9847606 Review. Japanese.
Cited by
-
Acute pancreatitis with gradient echo T2*-weighted magnetic resonance imaging.Quant Imaging Med Surg. 2016 Apr;6(2):157-67. doi: 10.21037/qims.2016.04.03. Quant Imaging Med Surg. 2016. PMID: 27190768 Free PMC article.
-
Impact of Imaging Techniques in the Assessment of Gallstone Pancreatitis.Curr Health Sci J. 2024 Apr-Jun;50(2):198-206. doi: 10.12865/CHSJ.50.02.04. Epub 2024 Jun 30. Curr Health Sci J. 2024. PMID: 39371066 Free PMC article. Review.
-
Magnetic resonance imaging for acute pancreatitis.World J Radiol. 2010 Aug 28;2(8):298-308. doi: 10.4329/wjr.v2.i8.298. World J Radiol. 2010. PMID: 21160684 Free PMC article.
-
Computed tomography characteristics of acute pancreatitis based on different etiologies at different onset times: a retrospective cross-sectional study.Quant Imaging Med Surg. 2022 Sep;12(9):4448-4461. doi: 10.21037/qims-21-1231. Quant Imaging Med Surg. 2022. PMID: 36060601 Free PMC article.
-
Magnetic resonance severity index assessed by T1-weighted imaging for acute pancreatitis: correlation with clinical outcomes and grading of the revised Atlanta classification-a narrative review.Gland Surg. 2020 Dec;9(6):2312-2320. doi: 10.21037/gs-20-554. Gland Surg. 2020. PMID: 33447582 Free PMC article. Review.
References
-
- Bradley EL 3rd, Allen K. A prospective longitudinal study of observation versus surgical intervention in the management of necrotizing pancreatitis. Am J Surg. 1991;161:19–24; discussion 24-25. - PubMed
-
- Bradley EL 3rd. A clinically based classification system for acute pancreatitis. Summary of the International Symposium on Acute Pancreatitis, Atlanta, Ga, September 11 through 13, 1992. Arch Surg. 1993;128:586–590. - PubMed
-
- Balthazar EJ. Pancreatitis. In: Gore RM, Levive MS, editors. Textbook of Gastrointestinal Radiology. Philadelphia, PA: WB Saunders Company; 2000. pp. 1767–1795.
-
- Balthazar EJ, Robinson DL, Megibow AJ, Ranson JH. Acute pancreatitis: value of CT in establishing prognosis. Radiology. 1990;174:331–336. - PubMed
-
- Morgan DE, Baron TH. Practical imaging in acute pancreatitis. Semin Gastrointest Dis. 1998;9:41–50. - PubMed
MeSH terms
LinkOut - more resources
Full Text Sources
Medical
