

Gamma and beta neural activity evoked during a sensory gating paradigm: effects of auditory, somatosensory and cross-modal stimulation
- PMID: 17008125
- PMCID: PMC1773003
- DOI: 10.1016/j.clinph.2006.08.003
Gamma and beta neural activity evoked during a sensory gating paradigm: effects of auditory, somatosensory and cross-modal stimulation
Abstract
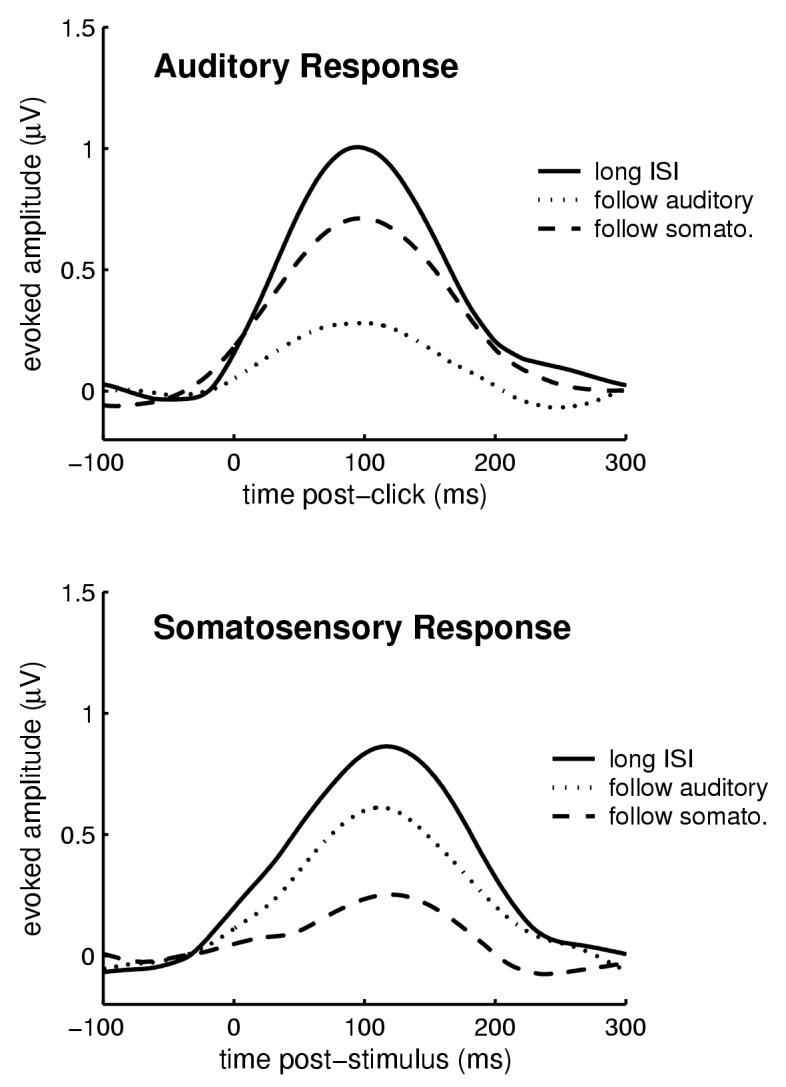
Objective: Stimulus-driven salience is determined involuntarily, and by the physical properties of a stimulus. It has recently been theorized that neural coding of this variable involves oscillatory activity within cortical neuron populations at beta frequencies. This was tested here through experimental manipulation of inter-stimulus interval (ISI).
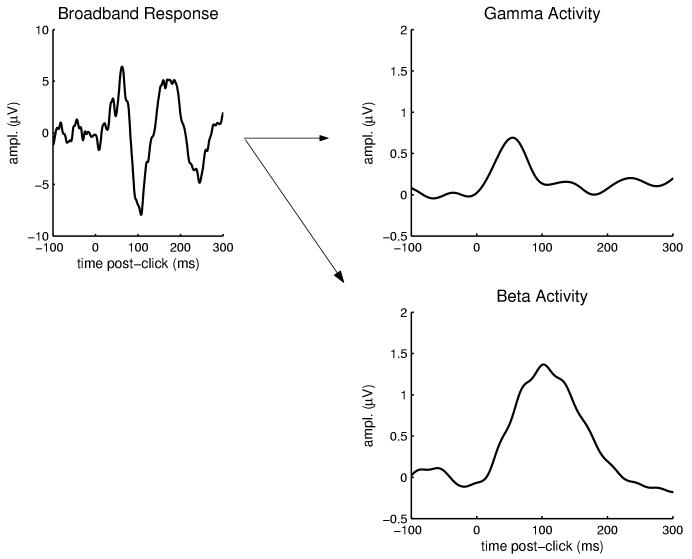
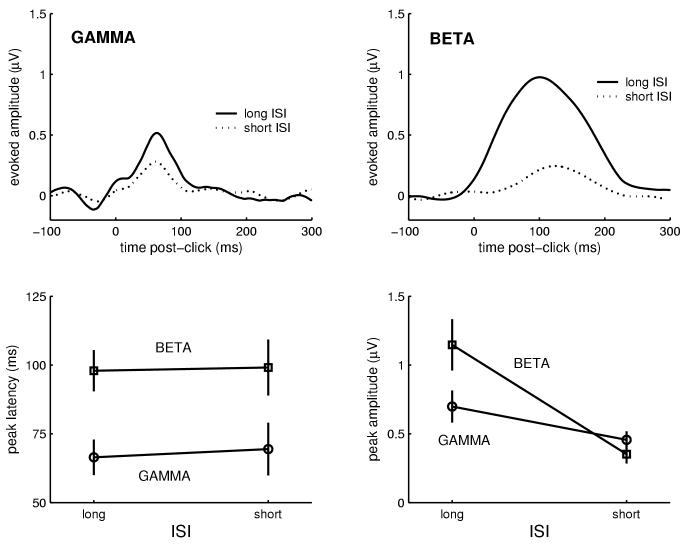
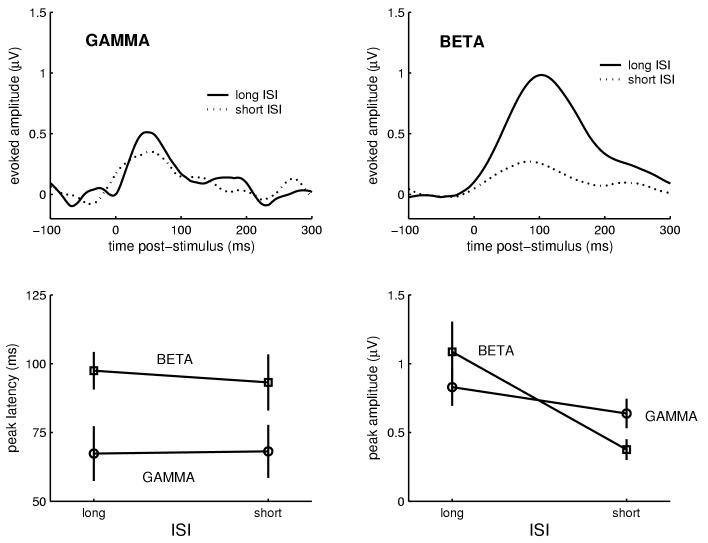
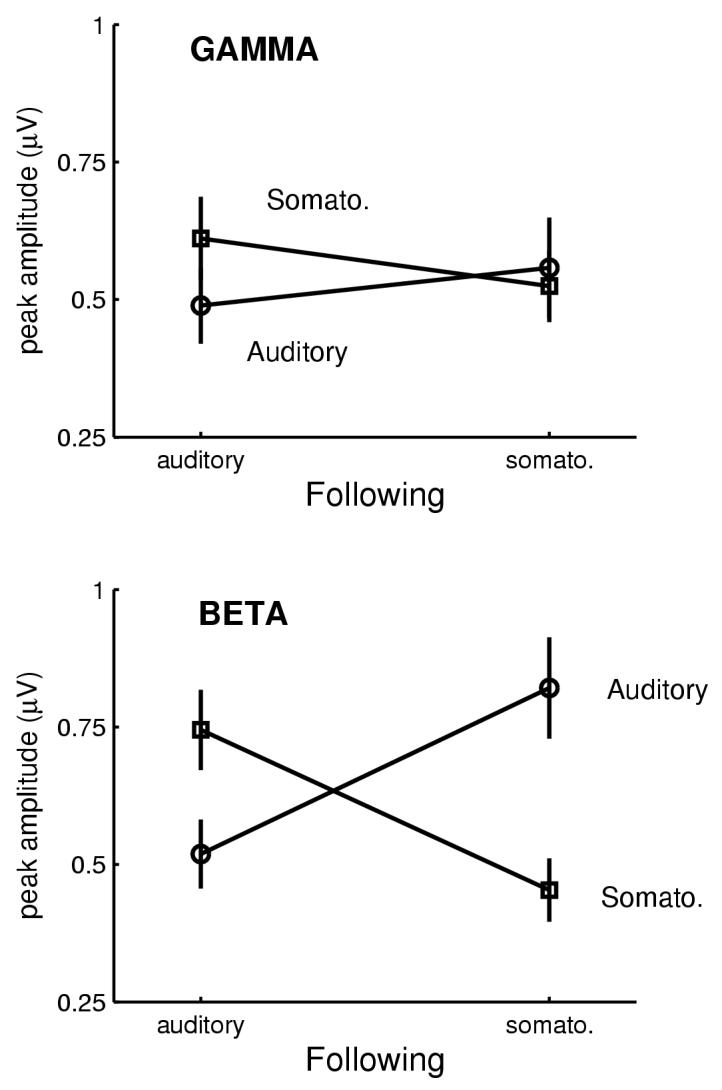
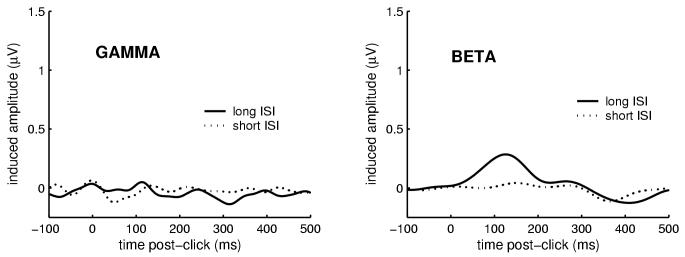
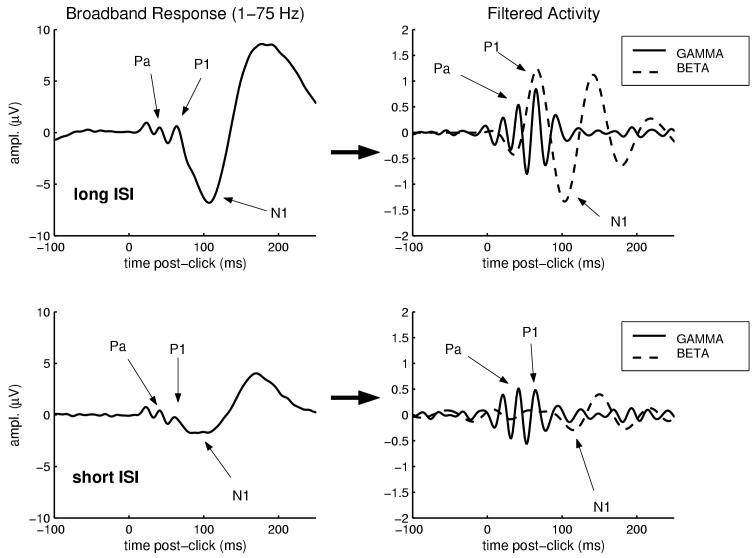
Methods: Non-invasive neurophysiological measures of event-related gamma (30-50 Hz) and beta (12-20 Hz) activity were estimated from scalp-recorded evoked potentials. Stimuli were presented in a standard "paired-stimulus" sensory gating paradigm, where the S1 (conditioning) stimulus was conceptualized as long-ISI, or "high salience", and the S2 (test) stimulus as short-ISI, or "low salience". Three separate studies were conducted: auditory stimuli only (N = 20 participants), somatosensory stimuli only (N = 20), and a cross-modal study for which auditory and somatosensory stimuli were mixed (N = 40).
Results: Early (20-150 ms) stimulus-evoked beta activity was more sensitive to ISI than temporally-overlapping gamma-band activity, and this effect was seen in both auditory and somatosensory studies. In the cross-modal study, beta activity was significantly modulated by the similarity (or dissimilarity) of stimuli separated by a short ISI (0.5 s); a significant cross-modal gating effect was nevertheless detected.
Conclusions: With regard to the early sensory-evoked response recorded from the scalp, the interval between identical stimuli especially modulates beta oscillatory activity.
Significance: This is consistent with developing theories regarding the different roles of temporally-overlapping oscillatory activity within cortical neuron populations at gamma and beta frequencies, particularly the claim that the latter is related to stimulus-driven salience.
Figures
Similar articles
-
Methodological considerations for a better somatosensory gating paradigm: The impact of the inter-stimulus interval.Neuroimage. 2020 Oct 15;220:117048. doi: 10.1016/j.neuroimage.2020.117048. Epub 2020 Jun 13. Neuroimage. 2020. PMID: 32544524 Free PMC article.
-
Synchronization of β and γ oscillations in the somatosensory evoked neuromagnetic steady-state response.Exp Neurol. 2013 Jul;245:40-51. doi: 10.1016/j.expneurol.2012.08.019. Epub 2012 Aug 27. Exp Neurol. 2013. PMID: 22955055
-
Steady state responses to temporally congruent and incongruent auditory and vibrotactile amplitude modulated stimulation.Int J Psychophysiol. 2013 Sep;89(3):419-32. doi: 10.1016/j.ijpsycho.2013.06.001. Epub 2013 Jun 11. Int J Psychophysiol. 2013. PMID: 23769951
-
Sensorimotor and cognitive involvement of the beta-gamma oscillation in the frontal N30 component of somatosensory evoked potentials.Neuropsychologia. 2015 Dec;79(Pt B):215-22. doi: 10.1016/j.neuropsychologia.2015.04.033. Epub 2015 May 19. Neuropsychologia. 2015. PMID: 26002756 Review.
-
Stimulus-specific oscillatory responses of the brain: a time/frequency-related coding process.Clin Neurophysiol. 2000 Apr;111(4):565-83. doi: 10.1016/s1388-2457(99)00271-0. Clin Neurophysiol. 2000. PMID: 10727907 Review.
Cited by
-
Could the Suboccipital Release Technique Result in a Generalized Relaxation and Self-Perceived Improvement? A Repeated Measure Study Design.J Clin Med. 2024 Oct 2;13(19):5898. doi: 10.3390/jcm13195898. J Clin Med. 2024. PMID: 39407957 Free PMC article.
-
Dysfunction of Inferior Parietal Lobule During Sensory Gating in Patients With Amnestic Mild Cognitive Impairment.Front Aging Neurosci. 2020 Feb 25;12:39. doi: 10.3389/fnagi.2020.00039. eCollection 2020. Front Aging Neurosci. 2020. PMID: 32158387 Free PMC article.
-
Beta oscillatory responses in healthy subjects and subjects with mild cognitive impairment.Neuroimage Clin. 2013 Jul 17;3:39-46. doi: 10.1016/j.nicl.2013.07.003. eCollection 2013. Neuroimage Clin. 2013. PMID: 24179847 Free PMC article.
-
Functional reorganization of neural networks involved in emotion regulation following trauma therapy for complex trauma disorders.Neuroimage Clin. 2019;23:101807. doi: 10.1016/j.nicl.2019.101807. Epub 2019 Apr 2. Neuroimage Clin. 2019. PMID: 30986752 Free PMC article.
-
Sensory gating event-related potentials and oscillations in schizophrenia patients and their unaffected relatives.Schizophr Bull. 2011 Nov;37(6):1187-99. doi: 10.1093/schbul/sbq027. Epub 2010 Apr 2. Schizophr Bull. 2011. PMID: 20363872 Free PMC article.
References
-
- Adler LE, Hoffer LJ, Griffith J, Waldo MC, Freedman R. Normalization by nicotine of deficient auditory sensory gating in the relatives of schizophrenics. Biol Psychiatry. 1992;32:607–616. - PubMed
-
- Adler LE, Olincy A, Cawthra E, Hoffer M, Nagamoto HT, Amass L, et al. Reversal of diminished inhibitory sensory gating in cocaine addicts by a nicotinic cholinergic mechanism. Neuropsychopharmacology. 2001;24:671–679. - PubMed
-
- Adler LE, Olincy A, Waldo M, Harris JG, Griffith J, Stevens K, et al. Schizophrenia, sensory gating, and nicotinic receptors. Schizophr Bull. 1998;24:189–202. - PubMed
-
- Alcaini M, Giard MH, Thevenet M, Pernier J. Two separate frontal components in the N1 wave of the human auditory evoked response. Psychophysiology. 1994;31:611–615. - PubMed
-
- Arnfred SM, Chen AC, Eder DN, Glenthoj BY, Hemmingsen RP. A mixed modality paradigm for recording somatosensory and auditory P50 gating. Psychiatry Res. 2001a;105:79–86. - PubMed
Publication types
MeSH terms
Grants and funding
LinkOut - more resources
Full Text Sources
