

Review
doi: 10.1113/jphysiol.2006.120121.
Epub 2006 Sep 28.
Computational principles of sensorimotor control that minimize uncertainty and variability
Affiliations
- PMID: 17008369
- PMCID: PMC2075158
- DOI: 10.1113/jphysiol.2006.120121
Item in Clipboard
Review
Computational principles of sensorimotor control that minimize uncertainty and variability
J Physiol.
.
Abstract
Sensory and motor noise limits the precision with which we can sense the world and act upon it. Recent research has begun to reveal computational principles by which the central nervous system reduces the sensory uncertainty and movement variability arising from this internal noise. Here we review the role of optimal estimation and sensory filtering in extracting the sensory information required for motor planning, and the role of optimal control, motor adaptation and impedance control in the specification of the motor output signal.
Figures
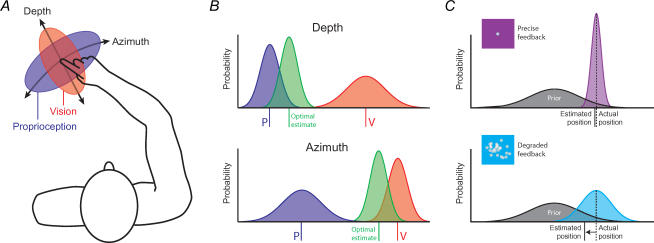
A, ellipses illustrate the precision of visual (red) and proprioceptive (blue) estimates of hand position in the horizontal plane. The narrower an ellipse in a certain direction, the more precise the estimate. (Adapted with permission from Van Beers et al. 2002.) B, the uncertainty in the sensory input can be represented as a probability distribution of possible locations. In depth (top), the proprioceptive estimate of position (blue) has a lower variance than the visual estimate (red). When there is a discrepancy between visual and proprioceptive estimates, the optimal combined estimate is obtained by weighting each source by the inverse of its variance. This combined estimate (green) has lower variance than either input alone. In azimuth (bottom), the relative precision of vision and proprioception is reversed, with the result that the optimal estimate now relies more on vision than proprioception. C, an estimate of position obtained from visual input alone can be improved by combining it with knowledge of a prior distribution of probable positions. The extent to which this prior distribution (grey) influences the optimal position estimate depends on the variance in the visual input. When visual feedback is very precise (top), the prior distribution has little effect, but when the variance of the visual estimate is increased (bottom), the optimal estimate becomes biased towards the mean of the prior distribution.
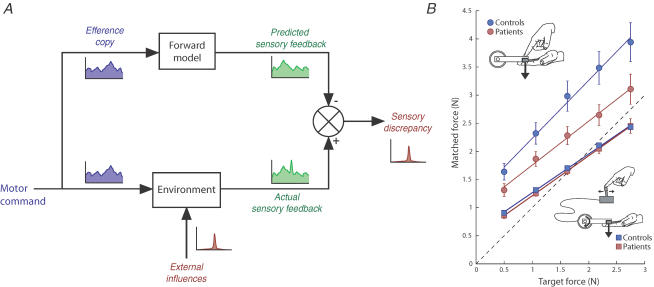
A, schematic representation of a sensory cancellation mechanism. On the basis of efference copy, a forward model predicts the sensory feedback that will result from a planned action. Subtracting this prediction from the actual sensory input reveals an estimate of the sensory feedback due to external influences. B, performance of healthy subjects (blue) and schizophrenic patients (red) on a force-matching task. Subjects were instructed to reproduce a target force, applied to the left index finger by a torque motor, either directly by pressing with the right index finger (circles) or indirectly by controlling the torque motor output with a joystick (squares). Average matching force is shown as a function of target force. Error bars indicate ± 1 s.e.m. across subjects. Dashed line represents perfect performance. Adapted with permission from Shergill et al. (2005).
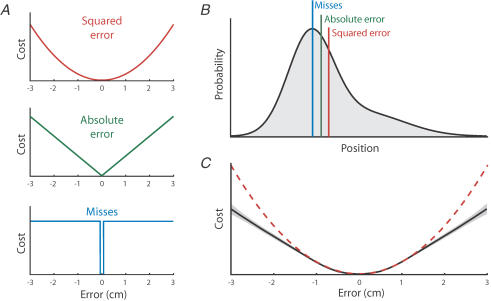
A, optimal control models attempt to minimize a specified ‘cost’, such as the error in position at the end of a movement. Cost functions are shown that minimize different features of position error: the squared error (top), the absolute error (middle), or the number of misses (i.e. non-zero errors, bottom). B, one of the asymmetric probability distributions of position used in Kording & Wolpert (2004b). Vertical lines indicate the point in the distribution that should be aligned with the target in order to minimize each of the cost functions shown in A. C, the continuous black line indicates the cost function inferred from the results of Kording & Wolpert (2004b); the grey area represents ± 1 s.e.m. across subjects. The squared error is shown for comparison (red dashed line). Adapted with permission from Kording & Wolpert (2004b).
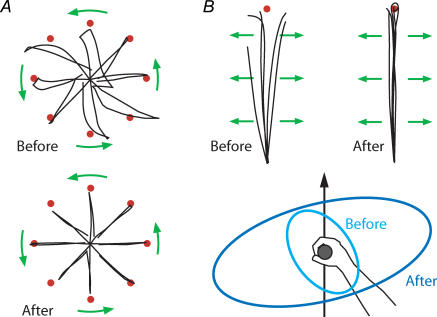
A, typical hand trajectories for out-and-back movements to targets (red) on first exposure to a velocity-dependent force field (top) and after 20 movement blocks (sets of 8 targets) in the field (bottom). Arrows (green) indicate the direction of force during outward movement. The increase in movement accuracy with training results from a strategy of motor adaptation, in which appropriate forces are generated to counteract the predictable force field. B, hand trajectories on first exposure to a divergent force field (top left), and after 100 movements in the field (top right). In this unpredictable force field, increased movement accuracy reflects a strategy of impedance control. Stiffness ellipses (bottom) indicate restoring force to a step displacement of the hand in different directions, before and after training. The increase in stiffness is tuned to the direction of maximum instability, perpendicular to the direction of motion (black arrow). Adapted with permission from Burdet et al. (2001).
Similar articles
-
Probabilistic mechanisms in sensorimotor control.Novartis Found Symp. 2006;270:191-8; discussion 198-202, 232-7. Novartis Found Symp. 2006. PMID: 16649715 Review.
-
Computational mechanisms of sensorimotor control.Neuron. 2011 Nov 3;72(3):425-42. doi: 10.1016/j.neuron.2011.10.006. Neuron. 2011. PMID: 22078503 Review.
-
Probabilistic models in human sensorimotor control.Hum Mov Sci. 2007 Aug;26(4):511-24. doi: 10.1016/j.humov.2007.05.005. Epub 2007 Jul 12. Hum Mov Sci. 2007. PMID: 17628731 Free PMC article. Review.
-
Computational principles of movement neuroscience.Nat Neurosci. 2000 Nov;3 Suppl:1212-7. doi: 10.1038/81497. Nat Neurosci. 2000. PMID: 11127840 Review.
-
Optimality, stochasticity, and variability in motor behavior.J Comput Neurosci. 2008 Feb;24(1):57-68. doi: 10.1007/s10827-007-0041-y. Epub 2007 May 22. J Comput Neurosci. 2008. PMID: 18202922 Free PMC article.
Cited by
-
The effect of fatigue from exercise on human limb position sense.J Physiol. 2010 Apr 15;588(Pt 8):1369-77. doi: 10.1113/jphysiol.2010.187732. Epub 2010 Mar 1. J Physiol. 2010. PMID: 20194123 Free PMC article.
-
Attainment of Quiet Standing in Humans: Are the Lower Limb Joints Controlled Relative to a Misaligned Postural Reference?Front Physiol. 2019 Jun 6;10:625. doi: 10.3389/fphys.2019.00625. eCollection 2019. Front Physiol. 2019. PMID: 31275151 Free PMC article.
-
Variability in locomotor dynamics reveals the critical role of feedback in task control.Elife. 2020 Jan 23;9:e51219. doi: 10.7554/eLife.51219. Elife. 2020. PMID: 31971509 Free PMC article.
-
Exploring disturbance as a force for good in motor learning.PLoS One. 2020 May 20;15(5):e0224055. doi: 10.1371/journal.pone.0224055. eCollection 2020. PLoS One. 2020. PMID: 32433704 Free PMC article.
-
Efference Copy Is Necessary for the Attenuation of Self-Generated Touch.iScience. 2020 Feb 21;23(2):100843. doi: 10.1016/j.isci.2020.100843. Epub 2020 Jan 16. iScience. 2020. PMID: 32058957 Free PMC article.
References
-
- Albus JS. A theory of cerebellar functions. Math Biosci. 1971;10:25–61.
-
- Angel RW, Malenka RC. Velocity-dependent suppression of cutaneous sensitivity during movement. Exp Neurol. 1982;77:266–274. - PubMed
-
- Bahill AT, Clark MR, Stark L. The main sequence, a tool for studying human eye movements. Math Biosci. 1975;24:191–204.
Publication types
MeSH terms
LinkOut - more resources
Full Text Sources