Comparative Study
. 2006 Dec 1;577(Pt 2):617-39.
doi: 10.1113/jphysiol.2006.118703. Epub 2006 Sep 28.

Modelling spinal circuitry involved in locomotor pattern generation: insights from deletions during fictive locomotion

Affiliations
Comparative Study

Modelling spinal circuitry involved in locomotor pattern generation: insights from deletions during fictive locomotion

Ilya A Rybak et al. J Physiol. .

Abstract

The mammalian spinal cord contains a locomotor central pattern generator (CPG) that can produce alternating rhythmic activity of flexor and extensor motoneurones in the absence of rhythmic input and proprioceptive feedback. During such fictive locomotor activity in decerebrate cats, spontaneous omissions of activity occur simultaneously in multiple agonist motoneurone pools for a number of cycles. During these 'deletions', antagonist motoneurone pools usually become tonically active but may also continue to be rhythmic. The rhythmic activity that re-emerges following a deletion is often not phase shifted. This suggests that some neuronal mechanism can maintain the locomotor period when motoneurone activity fails. To account for these observations, a simplified computational model of the spinal circuitry has been developed in which the locomotor CPG consists of two levels: a half-centre rhythm generator (RG) and a pattern formation (PF) network, with reciprocal inhibitory interactions between antagonist neural populations at each level. The model represents a network of interacting neural populations with single interneurones and motoneurones described in the Hodgkin-Huxley style. The model reproduces the range of locomotor periods and phase durations observed during real locomotion in adult cats and permits independent control of the level of motoneurone activity and of step cycle timing. By altering the excitability of neural populations within the PF network, the model can reproduce deletions in which motoneurone activity fails but the phase of locomotor oscillations is maintained. The model also suggests criteria for the functional identification of spinal interneurones involved in the mammalian locomotor pattern generation.


Figures

Figure 1
Figure 1. Schematic illustration of the two-level central pattern generator (CPG) concept
The locomotor CPG consists of a half-centre rhythm generator (RG) and a pattern formation (PF) network. The RG defines the locomotor rhythm and the durations of flexor and extensor phases and controls the activity of the PF network. The PF network contains interneurone populations (green spheres), each of which provides excitation to multiple synergist motoneurone pools (diamonds) and is connected with other PF populations via a network of inhibitory connections. Activation of a particular PF population activates the corresponding muscle synergy. The PF network mediates rhythmic input from the RG to motoneurones and distributes it among the motoneurone pools. Depending on the input from the RG and the interactions within the PF network, each PF population is active within particular phase(s) of the step cycle and produces a phase-specific, synchronized activation of the corresponding group of synergist motoneurone pools. Afferent feedback and spontaneous perturbations may affect the CPG either at the level of the RG, producing alterations (e.g. phase shifting or resetting) of the locomotor rhythm, or at the level of PF, altering the level of motoneurone activation and/or the timing of phase transitions without shifting the phase of (or resetting) the locomotor rhythm generated by the RG. See details in the text.
Figure 2
Figure 2. Model schematic and performance
A, schematic of the model. Populations of interneurones are represented by spheres. Excitatory and inhibitory synaptic connections are shown by arrows and small circles, respectively. Populations of motoneurones are represented by diamonds. See explanations in the text. B and C, model performance: the locomotor patterns generated by the model. Activity of each population is represented by a histogram of average firing frequency (number of spikes per second per neurone, bin = 30 ms). In B, the MLR drive to RG-E (drg-e) population is larger than to RG-F population (drg-f = 0.43; drg-e = 0.5), and the model generates a rhythm with a longer duration extensor phase (TE > TF). In C, the RG-F population receives a larger drive (drg-f = 0.51; drg-e = 0.45), and the model generates a flexion-dominated rhythm (TF > TE).
Figure 3
Figure 3
Rhythm generator performance under different conditions A, generation of rhythmic activity evoked by supraspinal (MLR) drive to the RG (drg-f = 0.51; drg-e = 0.45). B, imitation of pharmacologically evoked rhythm in the model. The slow rhythmic activity was produced by an increase in excitability of the excitatory CPG populations (RGs and PFs) in the absence of external (MLR) drive. The increase of excitability was produced by a 6 mV depolarization of the average leakage reversal potential in all neurons of these populations. C, rhythmic activity produced in the model by disinhibiton. To simulate this behaviour, the weights of all inhibitory connections in the model were set to zero. Note synchronized rhythmic bursts of flexors and extensors. See details in the text.
Figure 4
Figure 4
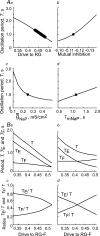
Durations of locomotor phases and step cycle and their dependence on model parameters Aa, increased drive to the RG populations reduces step cycle duration (T) (a symmetrical case is considered: drg-f =drg-e = 0.32–0.52, see the horizontal axis). Ab, T monotonically increases with an increase in mutual inhibition between the RG populations. The increase of mutual inhibition was imposed by increasing the absolute value of the weight of inhibitory synaptic input from Inrg-E to RG-E and from Inrg-F to RG-F, which is indicated in the horizontal axis (see Fig. 2A). Ac, T monotonically decreases with an increase of the maximal conductance of NaP channels in RG neurons (g¯NaP) whose value is indicated in the horizontal axis. Ad, T linearly increases with an increasing maximal time constant for NaP channel inactivation (τhNaPmax) indicated in the horizontal axis. In AbAd, drg-f =drg-e = 0.42. BaBd, the duration of step cycle and locomotor phases (T, TF and TE in Ba and Bb) and the relative durations of locomotor phases (TF/T and TE/T in Bc and Bd) produced by the model. MLR drive to the RG-E population was maintained constant (drg-e = 0.52 in Ba and Bc, and drg-e = 0.41 in Bb and Bd). Drive to RG-F (drg-f) was progressively increased from 0.32 to 0.52 in Ba and Bc, and from 0.31 to 0.51 in Bb and Bd, see the horizontal axes in BaBd. Note that an increase of MLR drive to RG-F produces only small changes in the duration of the flexor phase, but substantially reduces the duration of the extensor phase and, correspondingly, the total duration of the step cycle.
Figure 5
Figure 5
Motoneurone activities in the model and in the cat A, examples of population activities of flexor and extensor motoneurones and membrane potential traces of single motoneurones in the model. Activities of flexor and extensor populations are represented by the average histograms (top trace for Mn-F and fourth trace for Mn-E) and raster plots (second trace for Mn-F and fifth trace for Mn-E). In both raster plots, the lines correspond to single motoneurones arranged by neurone numbers from 1 to 20, and the dots in each line represent spikes. Membrane potentials of one flexor and one extensor motoneurone are shown in third and bottom traces, respectively, with action potentials truncated at the level of −10 mV. In this simulation, the MLR drive to RG-F (drg-f) was 0.52 and to RG-E (drg-e) 0.46. B, records during MLR-evoked fictive locomotion showing electroneurogram (ENG) activity of ankle (tibialis anterior, TA) and hip (sartorius, Sart) flexors, ankle (medial gastrocnemius, MG) and hip (semimembranosus combined with anterior biceps, SmAB) extensors, and simultaneous intracellular recordings from a Sart and an SmAB motoneurone.
Figure 6
Figure 6
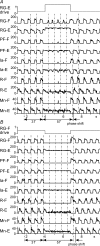
Simulations of ‘resetting’ deletions A, an example of simulation of a resetting deletion. In this example, the deletion of flexor activity was produced by a temporary 400% increase in excitatory drive to the RG-E population (see the top trace). The increased drive changed RG-E population activity from phasic to sustained. Consequently during this additional excitation, all populations on the extensor side of the network (Ia-E, R-E and Mn-E) showed sustained activity, whereas all populations on the flexor side (Ia-F, R-F and Mn-F) were inhibited. As a result, at the motoneurone level (two bottom traces) there was a typical deletion of flexor motoneurone activity with a sustained activity of extensor motoneurones. B, in this example, the deletion of flexor activity was produced by a temporary removal of excitatory drive to the RG-F population (see the top trace). In both A and B, the vertical dotted lines are plotted at intervals representing the step cycle period preceding the deletion. These lines indicate where the onsets of extensor bursts would have occurred if there had been no deletion. Note that in both cases (A and B), when the applied ‘perturbation’ ends, the post-deletion rhythm re-appears with a phase shift in respect to the pre-deletion rhythm (see arrows at the bottom of each panel). In these simulations: drg-f = 0.46; drg-e = 0.5.
Figure 7
Figure 7
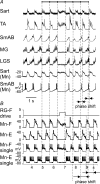
Example of ‘resetting’ deletion A, a brief deletion of extensor activity that occurred during MLR-evoked fictive locomotion (Lafreniere-Roula & McCrea, 2005). The traces are rectified-integrated recordings from hip (sartorius, Sart) and ankle (tibialis anterior, TA) flexors, and hip (semimembranosus combined with anterior biceps, SmAB) and ankle (medial gastrocnemius (MG)) and lateral gastrocnemius combined with soleus, LGS) extensors. The bottom traces show simultaneous intracellular recordings from a Sart and a SmAB motoneurone. The vertical dotted lines are plotted at the intervals representing the average period calculated for the five step-cycle periods preceding the deletions. These lines indicate approximately where the onsets of flexor bursts would have occurred had there been no deletion. They show that the deletion is accompanied by an obvious phase shift of the post-deletion rhythm with respect to the pre-deletion rhythm (see arrows at the bottom). B, data from our simulation (similar to that in Fig. 6A) with the parameters (MLR drives) adjusted to fit phase durations in A (drg-f = 0.48; drg-e = 0.5). In this simulation, a deletion of extensor activity was produced by additional excitatory drive to the RG-F population (see the top trace). The two bottom traces show changes in the membrane potential of a single flexor and extensor motoneurone, respectively (action potentials truncated at −40 mV). As in the case of experimental recordings (see A), the ‘perturbation’ applied to the RG produced a resetting deletion accompanied by a shift in the phase of the post-deletion rhythm (see arrows at the bottom).
Figure 8
Figure 8
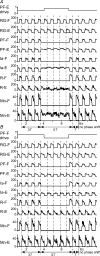
Simulation of ‘non-resetting’ deletions A, an example of simulation of non-resetting deletion. The deletion of flexor activity was produced by a temporary 90% increase in excitatory drive to the PF-E population (see the top trace). This additional drive produced sustained PF-E population activity that inhibited the PF-F population. As a result, during the deletion there was sustained activity in all populations on the extensor side of the network (Ia-E, R-E and Mn-E), whereas all populations on the flexor side (Ia-F, R-F and Mn-F) were inhibited. At the motoneurone level (two bottom traces), there was a typical deletion of flexor motoneurone activity with a sustained activity of extensor motoneurones. B, an example of simulation of a non-resetting deletion with maintained rhythmic activity in antagonists. A temporary removal of excitatory drive to the PF-F population (see the top trace) stopped the activity of this population. Rhythmic activity was maintained, however, in the PF-E population because of the phasic inhibition provided by the RG-F population via the Inrg-E population (see Fig. 2A). As a result, at the motoneurone level (two bottom traces) there was a deletion of flexor motoneurone activity with maintained rhythmic activity of extensor motoneurones. As in Fig. 6, the vertical dotted lines in both panels are plotted at intervals representing the step cycle period preceding the deletion. These lines show that in both cases (A and B), the rhythm re-appeared after deletion without a phase shift with respect to the pre-deletion rhythm (see arrows at the bottom of each panels). In both simulations: drg-f = 0.48; drg-e = 0.5. Note that all changes (stepwise increase and decrease) of the total drive were applied in the middle of the ongoing phase to ensure that the timing of the post-deletion rhythm was controlled by rhythmic input from the RG.
Figure 9
Figure 9. ‘Non-resetting’ deletions of flexor activity with a sustained activity of extensors
Aa, an example of deletion of flexor activity occurring during MLR-evoked fictive locomotion (Lafreniere-Roula & McCrea, 2005). The traces are rectified–integrated recordings from hindlimb flexors (hip – sartorius (Sart), and ankle – extensor digitorum longus (EDL)) and extensors (hip – semimembranosus combined with anterior biceps (SmAB), knee – quadriceps (Quad) and ankle – medial gastrocnemius (MG) and plantaris (Plant)). As in Fig. 7, the distance between the vertical dotted lines is the average step cycle period prior to the deletions. These lines indicate where the onsets of flexor bursts would have occurred if there had been no deletion. They show that the phase of the locomotor rhythm is maintained after the deletion. A weak modulation of the sustained extensor motoneurone activity is indicated (*). Ab, another example of deletion of flexor activity. An epoch of fictive locomotion is shown during which there was no contralateral (co) flexor and extensor activity (see coTA and coMG traces). The non-resetting deletion of ipsilateral flexor activity (in which two bursts in the iTA trace were omitted) was accompanied by a sustained firing of ipsilateral (i) extensors (iAB and iLGS). As in the example shown in Aa, the vertical dotted lines show that the phase of the locomotor rhythm is maintained after the deletion despite the absence of contralateral locomotor activity. Ba, data from our simulation (as in Fig. 8A) with the parameters (MLR drives) adjusted to fit phase durations in Aa (drg-f = 0.44; drg-e = 0.55). In this simulation, a deletion of flexor activity was produced by increased excitatory drive to the PF-E population (see the top trace). As in the experimental recordings in Aa, the phase of the locomotor rhythm is maintained after the deletion. The two bottom traces show changes in the membrane potential of single flexor and extensor motoneurones, respectively (action potentials truncated at −40 mV). In the experimentally observed deletion shown in Aa, first two flexor bursts are missing then one burst appears and then another is missing. To reproduce a similar pattern in the simulation, the drive to PF-E was increased to near threshold for reproducing the deletion (providing an 88% increase in total drive). Using a randomization process, the simulation was repeated until the data illustrated in Ba were obtained. Other deletion trials showed deletions of all four sequential flexor bursts or had flexor activity in one of the other deleted cycles. Note that during the deletion, the simulated flexor motoneurone (Mn-F) is hyperpolarized. The extensor motoneurone shows phasic modulation in its spiking without hyperpolarization, similar to that observed in ENGs of extensors (SmAB, Quad and Plant) in Aa. Bb, data from our simulation (similar to data in Fig. 8A) with the MLR drives adjusted to fit phase durations in Ab (drg-f = 0.5; drg-e = 0.5). The deletion of flexor activity was produced by an additional temporary excitatory drive to the PF-E population (see the top trace). As in the experimental recordings in Ab, the phase of the locomotor rhythm is maintained after the deletion.
Figure 10
Figure 10
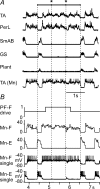
‘Non-resetting’ deletion of extensor activity with a sustained activity of flexors A, an example of a deletion of extensor activity during fictive locomotion. The recordings were made from ankle flexors (tibialis anterior, TA) and peroneus longus, PerL), and hip (semimembranosus combined with anterior biceps, SmAB) and ankle (gastrocnemius combined with soleus, GS, and plantaris, Plant) extensors (Lafreniere-Roula & McCrea, 2005). The vertical dotted lines, indicating where the onsets of extensor bursts would have occurred had there been no deletion, show that the phase of the locomotor rhythm is maintained after the deletion. The bottom trace is an intracellular recording from TA motoneurone. B, data from our simulation with the parameters (MLR drives) adjusted to fit phase durations in A (drg-f = 0.62; drg-e = 0.44). In this simulation, a deletion of extensor activity was produced by a 100% increase in excitatory drive to the PF-F population (see the top trace). As in the experimental recordings in A, the phase of the locomotor rhythm is maintained after deletion. The two bottom traces show changes in the membrane potential of single flexor and extensor motoneurones, respectively (action potentials truncated at −40 mV). Note that during the deletion the extensor motoneurone is hyperpolarized whereas the flexor motoneurone shows phasic modulation without an obvious hyperpolarization similar to that in an intracellular recording from TA motoneurone (see the bottom trace in A).
Figure 11
Figure 11. Example of a non-resetting deletion with maintained rhythmic activity of antagonist motoneurones
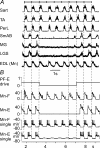
A, example of a deletion of extensor activity accompanied by continued rhythmic activity of flexor motoneurones (Lafreniere-Roula & McCrea, 2005). The recordings were made from hip (sartorius, Sart) and ankle (tibialis anterior, TA, and peroneus longus, PerL) flexors, and hip (semimembranosus combined with anterior biceps, SmAB) and ankle (medial gastrocnemius, MG, and lateral gastrocnemius combined with soleus, LGS) extensors. The bottom trace shows intracellular recording from an extensor digitorum longus (EDL) motoneurone that did not generate action potentials during fictive locomotion. The vertical dotted lines indicate where the termination of extensor bursts would have occurred if there had been no deletion. They show that the phase of the locomotor rhythm is maintained after deletion. B, data from our simulation (similar to data in Fig. 8B) with the MLR drives adjusted to fit phase durations in A (drg-f = 0.46; drg-e = 0.48). In this simulation, a deletion of flexor activity was produced by a temporary removal of excitatory drive to the PF-E population (see the top trace). Two bottom traces show membrane potentials of single flexor and extensor motoneurones, respectively (action potentials truncated at −45 mV). As in the experimental recordings in A, the phase of the locomotor rhythm did not change after deletion.

Comment in

Similar articles

Cited by

References

    1. Beato M, Nistri A. Interaction between disinhibited bursting and fictive locomotor patterns in the rat isolated spinal cord. J Neurophysiol. 1999;82:2029–2038. - PubMed
    1. Booth V, Rinzel J, Kiehn O. Compartmental model of vertebrate motoneurons for Ca2+-dependent spiking and plateau potentials under pharmacological treatment. J Neurophysiol. 1997;78:3371–3385. - PubMed
    1. Bracci E, Ballerini L, Nistri A. Localization of rhythmogenic networks responsible for spontaneous bursts induced by strychnine and bicuculline in the rat isolated spinal cord. J Neurosci. 1996;16:7063–7076. - PMC - PubMed
    1. Brownstone RM, Jordan LM, Kriellaars DJ, Noga BR, Shefchyk SJ. On the regulation of repetitive firing in lumbar motoneurones during fictive locomotion in the cat. Exp Brain Res. 1992;90:441–455. - PubMed
    1. Burke RE, Degtyarenko AM, Simon ES. Patterns of locomotor drive to motoneurons and last-order interneurons: clues to the structure of the CPG. J Neurophysiol. 2001;86:447–462. - PubMed

Publication types