. 2006 Oct 10;103(41):15062-7.
doi: 10.1073/pnas.0605868103. Epub 2006 Sep 28.

NMR structural and kinetic characterization of a homeodomain diffusing and hopping on nonspecific DNA

Affiliations

NMR structural and kinetic characterization of a homeodomain diffusing and hopping on nonspecific DNA

Junji Iwahara et al. Proc Natl Acad Sci U S A. .

Abstract

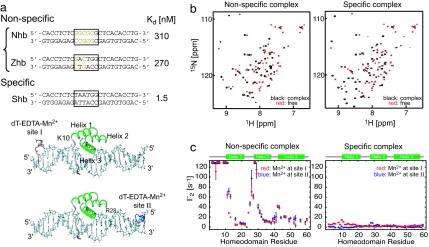
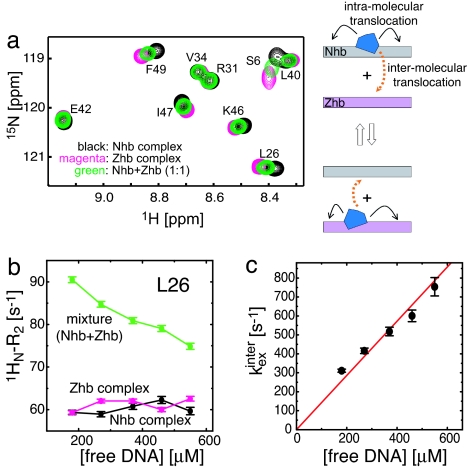
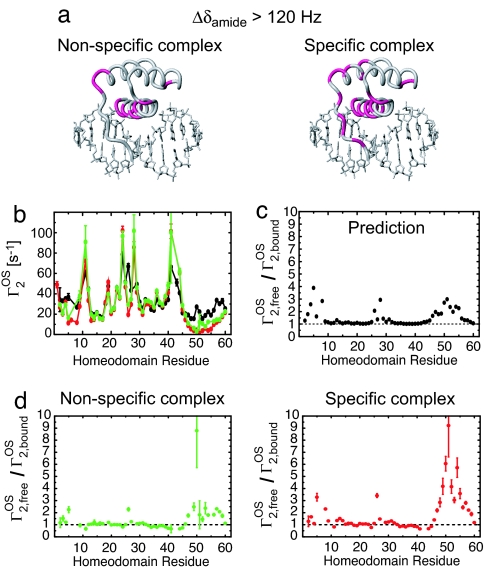
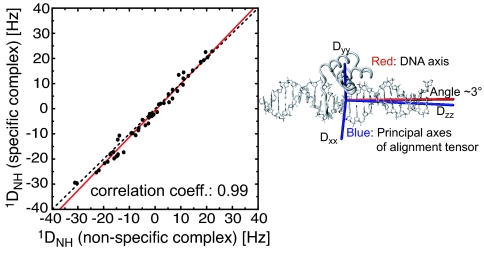
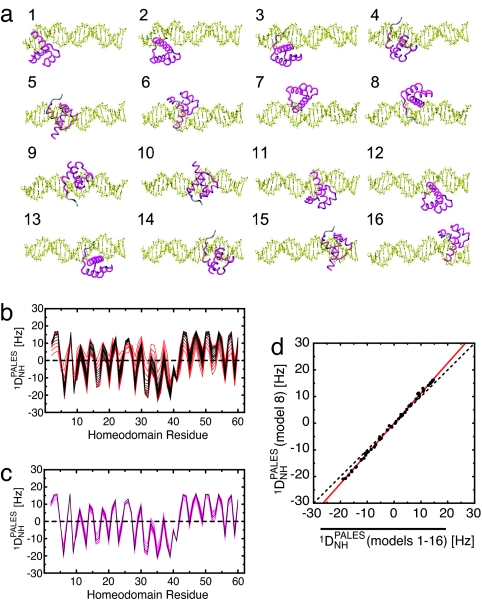
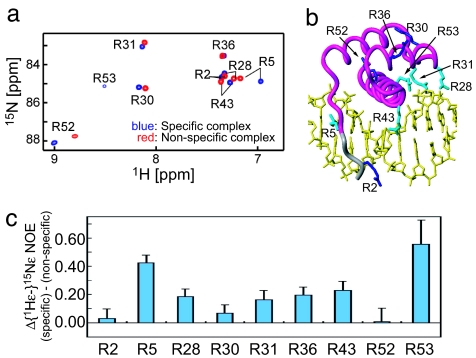
Nonspecific protein-DNA interactions are inherently dynamic and involve both diffusion of the protein along the DNA and hopping of the protein from one DNA molecule or segment to another. Understanding how gene regulatory proteins interact nonspecifically with DNA in terms of both structure and dynamics is challenging because the experimental observables are an ensemble average of many rapidly exchanging states. By using a variety of NMR spectroscopic techniques, including relaxation analysis, paramagnetic relaxation enhancement, and residual dipolar couplings, we have characterized structural and kinetic aspects of the interaction of the HoxD9 homeodomain with a nonspecific, 24-bp DNA duplex in a system in which the protein is not constrained to any particular site. The data reveal that HoxD9 binds to nonspecific DNA with the same binding mode and orientation as that observed in the specific complex. The mobility, however, of Arg side-chains contacting the DNA is increased in the nonspecific complex relative to the specific one. The kinetics of intermolecular translocation between two different nonspecific DNA molecules have also been analyzed and reveal that at high DNA concentrations (such as those present in vivo) direct transfer from one nonspecific complex to another nonspecific DNA molecule occurs without going through the intermediary of free protein. This finding provides a simple mechanism for accelerating the target search in vivo for the specific site in a sea of nonspecific sites by permitting more effective sampling of available DNA sites as the protein jumps from one segment to another.


Conflict of interest statement

The authors declare no conflict of interest.

Figures

Fig. 1.
Fig. 1.
Specific and nonspecific HoxD9–DNA complexes. (a) DNA duplexes of 24 bp were used in the current study. Shb contains a single 6-bp homeodomain-binding motif (boxed area), which is disrupted by 2- and 5-bp mutations (orange) for the nonspecific Zhb and Nhb DNA duplexes, respectively. KD values (11) at 100 mM NaCl are listed. (b) 1H-15N HSQC spectra of the uniformly 2H,15N-labeled HoxD9 homeodomain free (red) and bound (black) to the Nhb nonspecific (Left) and Shb specific (Right) DNA duplexes. For the specific complex, all cross-peaks are observed; for the nonspecific complexes (Nhb and Zhb), Tyr-8 is not observed, and Trp-48 and Asn-51 are significantly broadened. (c) Intermolecular 1HN2 PREs arising from the dT-EDTA-Mn2+ measured on uniformly 2H,15N-labeled HoxD9 homeodomain bound to the Nhb nonspecific (Left) and Shb-specific (Right) DNA duplexes at 20 mM NaCl. Two PRE data sets arising from dT-EDTA-Mn2+ at sites I (red) and II (blue) are plotted for the two complexes. The amide protons broadened beyond detection because of very large PRE are indicated by asterisks.
Fig. 2.
Fig. 2.
Kinetics of intermolecular translocation between nonspecific DNA duplexes. (a) Overlay of three 1H-15N HSQC spectra measured on nonspecific complexes comprising Nhb (black) and Zhb (magenta) duplexes and their 1:1 mixture (green). (b) Amide 1HN-R2 rates for Leu-26 as a function of free DNA concentration measured by Lorentzian line-shape-fitting in the 1H dimension of the 1H-15N HSQC spectra. HoxD9 was 2H,15N-labeled, yielding a pure Lorentzian line shape without 3JHNHα splitting. In processing, a 5-Hz, line-broadening exponential window function was applied in the 1H-dimension and then subtracted from the fitted value of R2. (c) Overall apparent intermolecular translocation rate kexinter plotted as function of [DNA]free{[Nhb + Zhb]free for the mixture with [Nhb]:[Zhb] = 1:1}. The value of kexinter was obtained by fitting all of the data for residues with ∣δNhb − δZhb∣ > 20 Hz (at a 1H frequency of 500 MHz) simultaneously, minimizing a χ2 function defined as Σ(Rex,calcinterRex,obsinter)22, where σ is the experimental error and Rex,calcinter is given by Eq. 1). Values of Rex,obsinter were obtained from the experimental values of R2Nhb, R2Zhb, and R2mixture.
Fig. 3.
Fig. 3.
The HoxD9 homeodomain binds to nonspecific DNA by using the same interface as that in the specific complex. (a) Residues exhibiting a large (>120 Hz at a 1H frequency of 600 MHz) 1HN/15N chemical shift perturbation, Δδamide [defined as (ΔδH2 + ΔδN2)1/2 in Hz], upon complex formation are colored in lilac on the structure of the specific complex. (b) 1HN2 PREs (Γ2OS) arising from 3 mM paramagnetic cosolute Gd-DTPA-BMA. Data measured on the nonspecific complex, specific complex and free protein are shown in green, red, and black, respectively. (c) Predicted profile of Γ2,freeOS2,boundOS for the specific complex. The ratio was predicted from the structures by using a grid-based approach (20, 21). The radius of the Gd–DTPA-BMA molecule was set to 3.5 Å. The correlation time for the PRE was assumed to be dominated by translational diffusion of the paramagnetic cosolute molecule and virtually identical for the free and bound states of the protein. (d) Experimental Γ2,freeOS2,boundOS ratios for the nonspecific and specific complexes. The binding interface can be identified from regions with Γ2,freeOS2,boundOS > 1.
Fig. 4.
Fig. 4.
Correlation between Pf1-induced 1DNH RDCs measured on the nonspecific (Nhb) and specific (Shb) HoxD9–DNA complexes. The red line is the linear regression (slope of 1.06). The data extend from residues 2–60 and include both the N-terminal arm (residues 1–9) and the core domain. The Pf1 concentration was 12 mg/ml, and the buffer contained 10 mM Tris·HCl (pH 6.8) and 20 mM NaCl. The quadrupole splittings of the solvent 2H resonance were 9.7 and 9.4 Hz for the nonspecific and specific complexes, respectively.
Fig. 5.
Fig. 5.
Prediction of Pf1-induced 1DNH RDCs for nonspecific complexes based on three-dimensional shapes and charge distribution using the program PALES (26). (a) Sixteen structure models for nonspecific complexes along a 24-bp DNA duplex with HoxD9 binding to DNA in the same binding mode but at different locations. Model 8 corresponds to the HoxD9–specific complex. (b) Predicted 1DNH RDCs for each residue. Results for models 1–16 are plotted (black, models 4–13; red, models 1–3 and 14–16). (c) 1DNH RDCs predicted for the specific complex (equivalent to model 8, black) and the average of the 1DNH RDCs predicted for 10 contiguous models (magenta; 7 lines correspond to averaging for models 1–10, 2–11, 3–12, 4–13, 5–14, 6–15, and 7–16). (d) Correlation between predicted 1DNH RDCs for the specific complex (model 8) and the average 1DNH values obtained for all 16 complexes. The red line is the linear regression (slope of 1.13). Further details are given in the supporting information.
Fig. 6.
Fig. 6.
Dynamics of Arg side-chains. (a) 1Hε-15Nε correlation spectrum for Arg side-chains in the nonspecific complex (red) and specific (blue) HoxD9–DNA complexes. (b) Locations of Arg residues in HoxD9. Arg residues in contact with DNA (14) appear cyan. (c) Difference between {1Hε-}15Nε heteronuclear NOEs measured for nonspecific and specific complexes.

References

    1. von Hippel PH, Berg OG. J Biol Chem. 1989;264:675–678. - PubMed
    1. Halford SE, Marko JF. Nucleic Acids Res. 2004;32:3040–3052. - PMC - PubMed
    1. Lewin B. Genes VII. Oxford: Oxford Univ Press; 2000.
    1. Bruinsma RF. Phys A. 2002;313:211–237.
    1. Winkler FK, Banner DW, Oefner C, Tsernoglou D, Brown RS, Heathman SP, Bryan RK, Martin PD, Petratos K, Wilson KS. EMBO J. 1993;12:1781–1795. - PMC - PubMed

Publication types

MeSH terms