. 2007 Feb 1;109(3):1095-102.
doi: 10.1182/blood-2006-05-022798. Epub 2006 Sep 28.

Annexin-1 modulates T-cell activation and differentiation

Affiliations

Annexin-1 modulates T-cell activation and differentiation

Fulvio D'Acquisto et al. Blood. .

Abstract

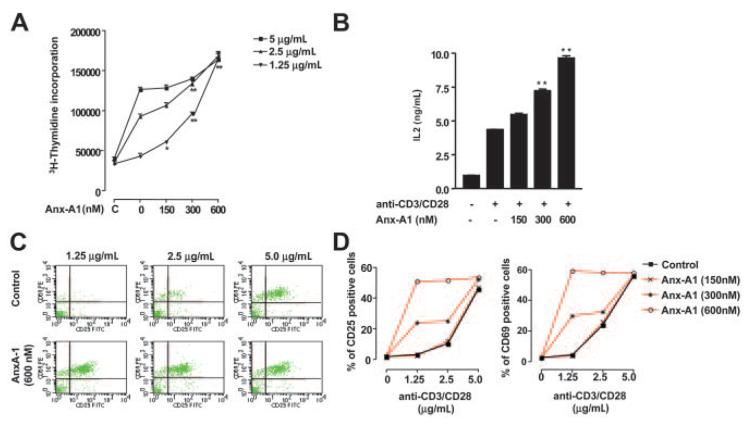
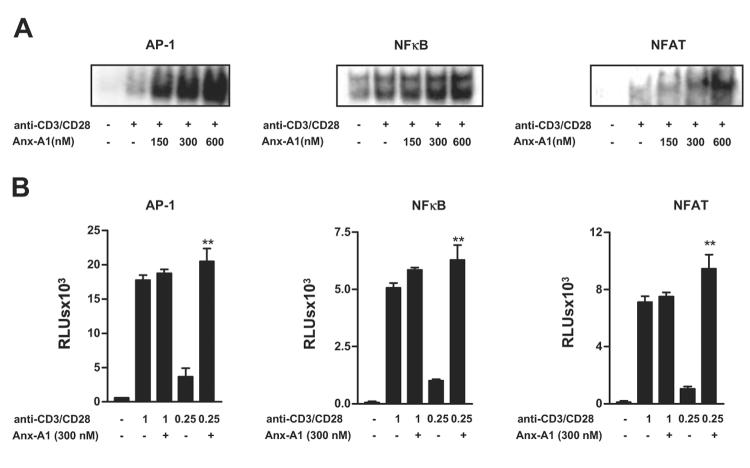
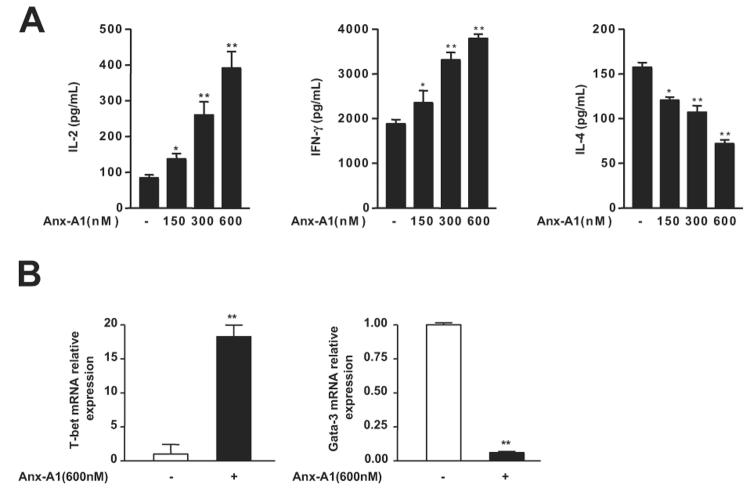
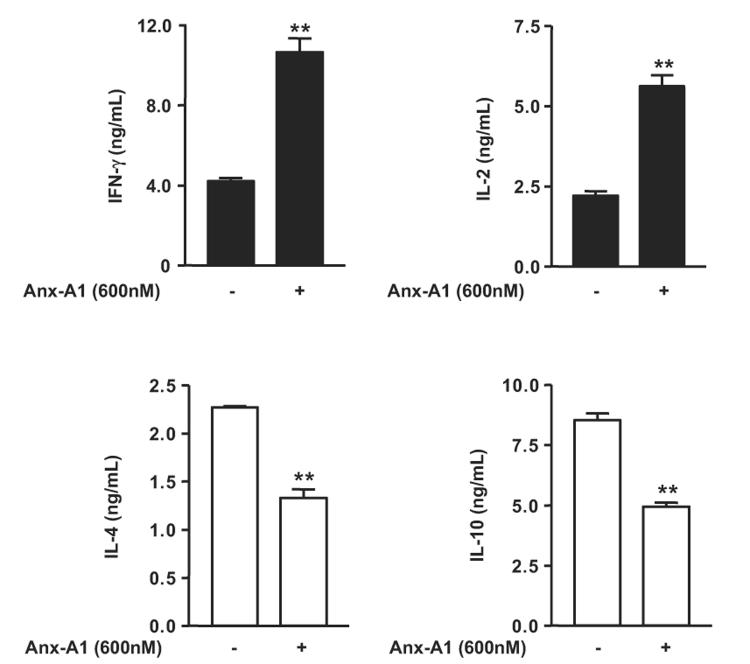
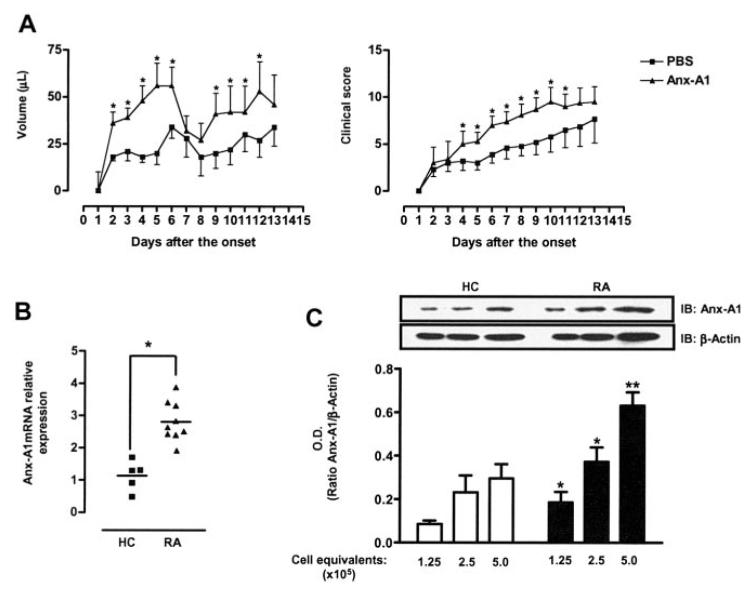
Annexin-1 is an anti-inflammatory protein that plays an important homeostatic role in innate immunity; however, its potential actions in the modulation of adaptive immunity have never been explored. Although inactive by itself, addition of annexin-1 to stimulated T cells augmented anti-CD3/CD28-mediated CD25 and CD69 expression and cell proliferation. This effect was paralleled by increased nuclear factor-kappaB (NF-kappaB), nuclear factor of activated T cells (NFATs), and activator protein-1 (AP-1) activation and preceded by a rapid T-cell receptor (TCR)-induced externalization of the annexin-1 receptor. Interestingly, differentiation of naive T cells in the presence of annexin-1 increased skewing in Th1 cells; in the collagen-induced arthritis model, treatment of mice with annexin-1 during the immunization phase exacerbated signs and symptoms at disease onset. Consistent with these findings, blood CD4+ cells from patients with rheumatoid arthritis showed a marked up-regulation of annexin-1 expression. Together these results demonstrate that annexin-1 is a molecular "tuner" of TCR signaling and suggest this protein might represent a new target for the development of drugs directed to pathologies where an unbalanced Th1/Th2 response or an aberrant activation of T cells is the major etiologic factor.


Figures

Figure 1
Figure 1
Effect of hrAnx-A1 on T-cell activation. (A) Murine naive lymph node T cells were stimulated with 5.0, 2.5, and 1.25 μg/mL anti-CD3/CD28 in the absence or presence of different concentrations of hrAnx-A1 for 24 hours and then pulsed with [3H]-thymidine to measure cell proliferation. (B) IL-2 production from primary murine naive lymph node T cells stimulated with anti-CD3/CD28 (1.25 μg/mL) in the absence or presence of different concentrations of hrAnx-A1 for 24 hours. (C, D) Murine naive lymph node T cells were stimulated with the indicated concentration of anti-CD3/CD28 in the absence (top panels) or presence (bottom panel) of hrAnx-A1 (600 nM) for 12 hours and then analyzed for CD25 and CD69 expression by FACS. Graphs on the left summarize the results obtained with 150, 300, and 600 nM Anx-A1. In all the experiments, values are mean ± the standard error (SE) of 4 to 5 mice. *P < .05; **P < .01.
Figure 2
Figure 2
Anx-A1 increases the strength of TCR signaling. (A) Electrophoretic mobility shift assay showing the effect of hrAnx-A1 on anti-CD3/CD28 (1.25μg/mL)–induced AP-1, NF-κB, and NFAT activation in T cells. Results are representative of 3 separate experiments with similar results. (B) Jurkat T cells were transfected with pAP-1-luc, pNF-κB-luc, and pNFAT-luc reporter constructs (3.0 μg) for 24 hours. Thereafter, cells were stimulated with the indicated concentrations of anti-CD3/CD28 in the presence or absence of hrAnx-A1 for 6 hours and then lysed to measure the luciferase activity. Values are the mean ± SE of 3 experiments in triplicate. **P < .01.
Figure 3
Figure 3
Activation of T cells induces the externalization of FPRL-1 and Anx-A1. (A) FACS analysis of FPRL-1 expression in human peripheral blood T cells incubated with medium alone (white) or stimulated with the indicated concentrations of anti-CD3/CD28 (gray). Results are representative of 3 separate experiments. (B) FACS analysis of FPRL-1 expression over time in unstimulated (white) or anti-CD3/CD28 (2.0 μg/mL)–stimulated (gray) human peripheral blood T cells. Results are representative of 3 separate experiments. (C) Western blot analysis of Anx-A1 levels in the cytosolic (Cyt) and membrane (Mem) fractions of human peripheral blood T cells stimulated with anti-CD3/CD28 (1.0 μg/mL) for 30 minutes. (D) Immunoprecipitation and immunoblotting analysis of Anx-A1 levels in the culture supernatants of human peripheral blood T cells stimulated with and without anti-CD3/CD28 (1.0 μg/mL) for 1 or 3 hours. (E, F) Western blot analysis of total and phospho Erk and Akt of human peripheral blood T cells stimulated with anti-CD3/CD28 (1.0 μg/mL) in the presence or absence of hrAnx-A1 (300 nM) for the indicated time. In all the experiments, results are representative of 3 separate experiments with similar results.
Figure 4
Figure 4
Effect of Anx-A1 on differentiation of naive cells in effector cells in Th0 condition. (A) Th1/Th2 cytokine production profile of naive lymph nodes T cells differentiated in vitro in Th0 condition in the presence or absence of the indicated concentrations of hrAnx-A1 and then restimulated with plate-bound anti-CD3 (5.0 μg/mL) for 8 hours. Values are the mean ± SE of 4 to 5 mice. *P < .05; **P < .01. (B) Analysis of T-bet and GATA-3 expression by real-time PCR in cells differentiated in Th0 conditions in the presence or absence of the indicated concentration of hrAnx-A1 for 4 days. Values are the mean ± SE of 3 to 4 mice. **P < .01.
Figure 5
Figure 5
Effect of hrAnx-A1 on differentiation of naive cells in effector cells in Th1 or Th2 conditions. Naive lymph node T cells were differentiated in vitro in Th1 (■) or Th2 (□) condition in the presence or absence of the indicated concentrations of hrAnx-A1 and then restimulated with plate-bound anti-CD3 (5.0 μg/mL) for 8 hours to measure Th1 (top graphs) or Th2 (bottom graphs) cytokine production. Values are the mean ± SE of 4 to 5 mice. **P < .01.
Figure 6
Figure 6
Anx-A1 and T cells in arthritis. (A) Paw volume and clinical score of DBA mice treated with PBS (100 μL) or hrAnx-A1 (1 μg subcutaneously twice a day) for 12 days during the immunization phase of the CIA model. Synchronization of disease onset was obtained by boosting with collagen on day 21, with clinical signs being evident from day 22 (day 1 of the onset of the diseases). Values are the mean ± SE of 6 to 8 mice. Groups were compared using the Mann-Whitney test. *P < .01. (B) Analysis of Anx-A1 expression in CD4+ cells of healthy control volunteers (HC) or patients with rheumatoid arthritis (RA). The median values are indicated by horizontal lines and P values of the Mann-Whitney test are shown. *P < .01. (C) Western blot analysis of Anx-A1 and β-actin levels in CD4+ cells of healthy control volunteers (HC) or patients with rheumatoid arthritis (RA). Results are representative of 5 different HCs or patients with RA. The bars represent the mean ratio ± SE of the optical density (OD) of Anx-A1 and β-actin bands from 5 different individuals. **P < .01.

References

    1. Perretti M, Gavins FN. Annexin 1: an endogenous anti-inflammatory protein. News Physiol Sci. 2003;18:60–64. - PubMed
    1. Perretti M, Flower RJ. Annexin 1 and the biology of the neutrophil. J Leukoc Biol. 2004;76:25–29. - PubMed
    1. Mancuso F, Flower RJ, Perretti M. Leukocyte transmigration, but not rolling or adhesion, is selectively inhibited by dexamethasone in the hamster post-capillary venule: involvement of endogenous lipocortin 1. J Immunol. 1995;155:377–386. - PubMed
    1. Chatterjee BE, Yona S, Rosignoli G, et al. Annexin 1-deficient neutrophils exhibit enhanced transmigration in vivo and increased responsiveness in vitro. J Leukoc Biol. 2005;78:639–646. - PubMed
    1. Gerke V, Creutz CE, Moss SE. Annexins: linking Ca2+ signalling to membrane dynamics. Nat Rev Mol Cell Biol. 2005;6:449–461. - PubMed

Publication types