

Magnetic resonance imaging captures the biology of ductal carcinoma in situ
- PMID: 17008702
- PMCID: PMC4087112
- DOI: 10.1200/JCO.2005.04.5518
Magnetic resonance imaging captures the biology of ductal carcinoma in situ
Abstract
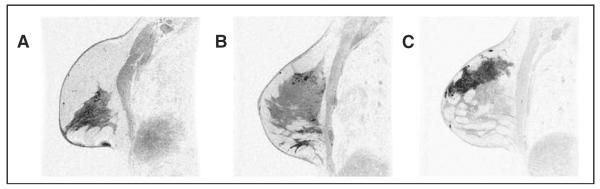
Purpose: Magnetic resonance imaging (MRI) is an important tool for characterizing invasive breast cancer but has proven to be more challenging in the setting of ductal carcinoma in situ (DCIS). We investigated whether MRI features of DCIS reflect differences in biology and pathology.
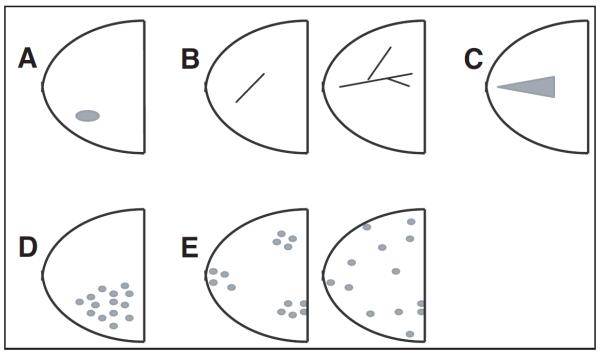
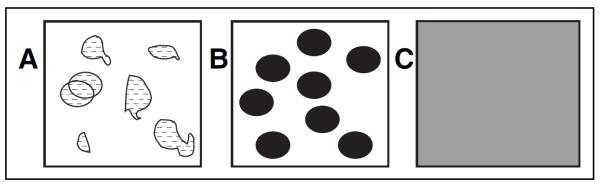
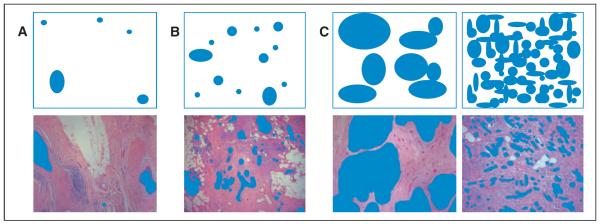
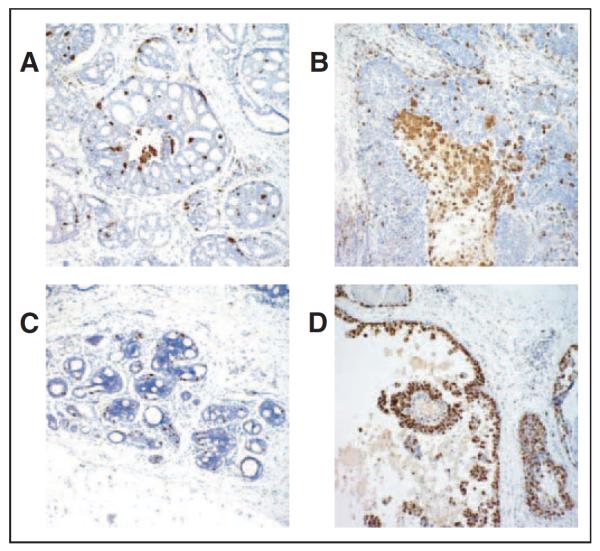
Patients and methods: Forty five of 100 patients with biopsy-proven DCIS who underwent MRI and had sufficient tissue to be characterized by pathologic (nuclear grade, presence of comedo necrosis, size, and density of disease) and immunohistochemical (IHC) findings (proliferation, Ki67; angiogenesis, CD34; and inflammation, CD68). Pathology and MRI features (enhancement patterns, distribution, size, and density) were analyzed using pairwise and canonical correlations.
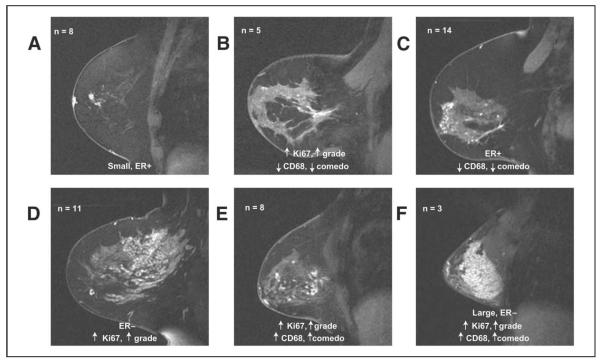
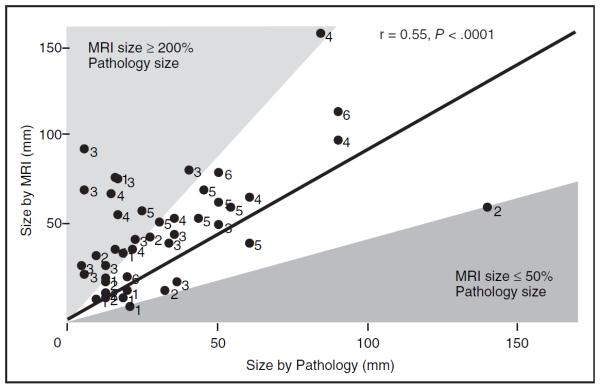
Results: Histopathologic and IHC variables correlated with MRI features (r = 0.73). The correlation was largely due to size, density (by either MRI or pathology), and inflammation (P < .05). Most small focal masses were estrogen receptor-positive. MRI enhancement patterns that were clumped were more likely than heterogeneous patterns to be high-grade lesions. Homogenous lesions were large, high grade, and rich in macrophages. Presence of comedo necrosis and size could be distinguished on MRI (P < .05). MRI was most likely to over-represent the size of less dense, diffuse DCIS lesions.
Conclusion: The heterogeneous presentation of DCIS on MRI reflects underlying histopathologic differences.
Figures
References
-
- Morrow M, Strom EA, Bassett LW, et al. Standard for the management of ductal carcinoma in situ of the breast (DCIS) CA Cancer J Clin. 2002;52:256–276. - PubMed
-
- Schnitt SJ, Connolly JL. Classification of ductal carcinoma in situ: Striving for clinical relevance in the era of breast conserving therapy. Hum Pathol. 1997;28:877–880. - PubMed
-
- Allred DC, O'Connell P, Fuqua SA, et al. Immunohistochemical studies of early breast cancer evolution. Breast Cancer Res Treat. 1994;32:13–18. - PubMed
-
- Fisher ER, Dignam J, Tan-Chiu E, et al. Pathologic findings from the National Surgical Adjuvant Breast Project (NSABP) eight-year update of Protocol B-17: Intraductal carcinoma. Cancer. 1999;86:429–438. - PubMed
-
- Hetelekidis S, Collins L, Silver B, et al. Predictors of local recurrence following excision alone for ductal carcinoma in situ. Cancer. 1999;85:427–431. - PubMed
Publication types
MeSH terms
Substances
Grants and funding
LinkOut - more resources
Full Text Sources
Other Literature Sources
Medical
