. 2007 Mar;14(3):453-61.
doi: 10.1038/sj.cdd.4402043. Epub 2006 Sep 29.

Death receptor ligation triggers membrane scrambling between Golgi and mitochondria

Affiliations

Death receptor ligation triggers membrane scrambling between Golgi and mitochondria

S Ouasti et al. Cell Death Differ. 2007 Mar.

Abstract

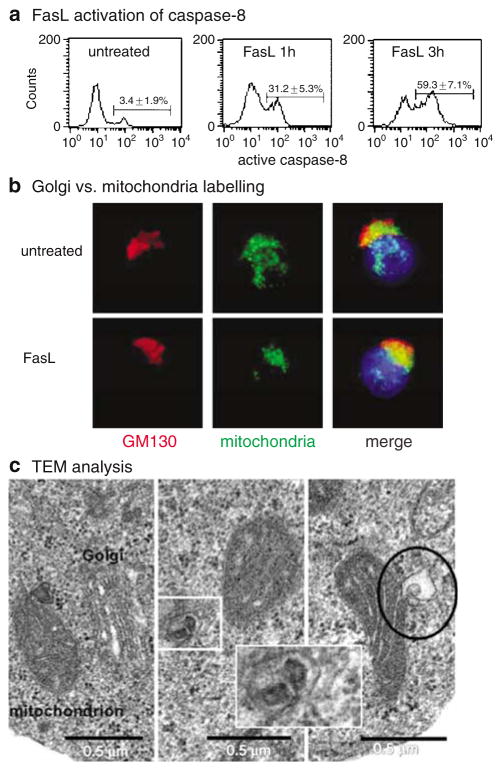
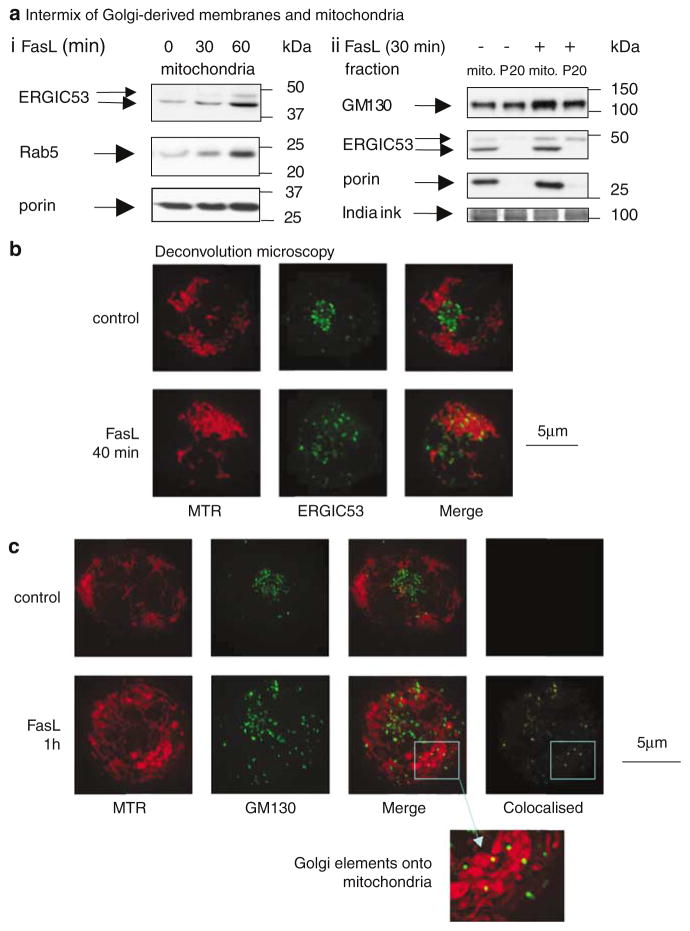
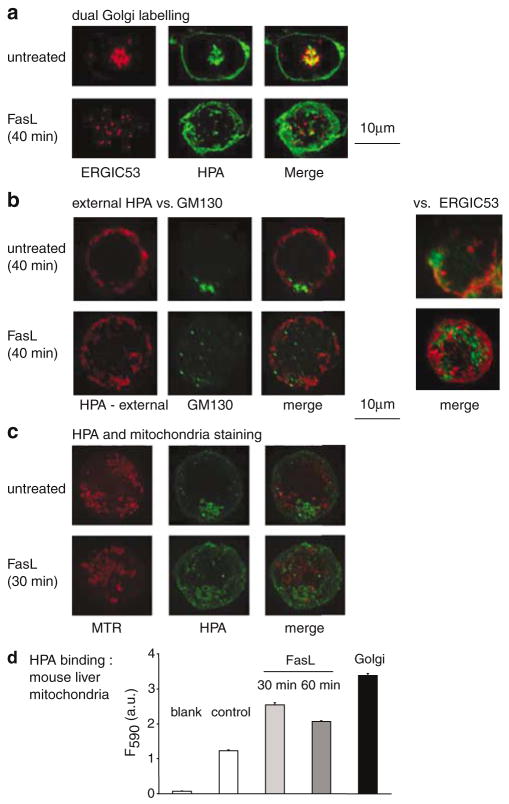
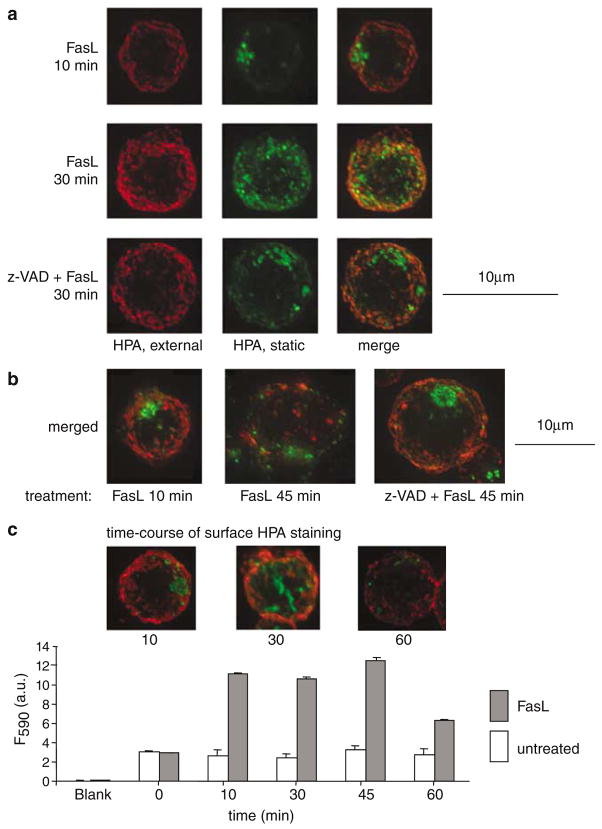
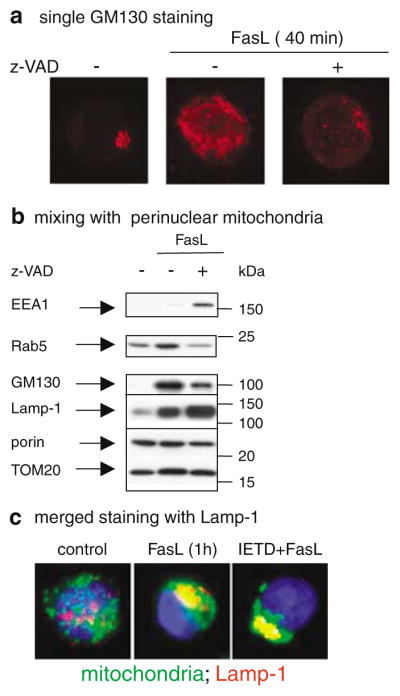
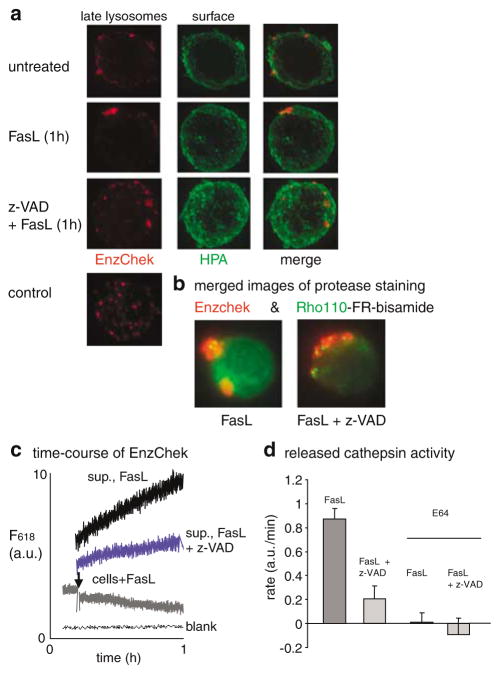
Subcellular organelles such as mitochondria, endoplasmic reticulum (ER) and the Golgi complex are involved in the progression of the cell death programme. We report here that soon after ligation of Fas (CD95/Apo1) in type II cells, elements of the Golgi complex intermix with mitochondria. This mixing follows centrifugal dispersal of secretory membranes and reflects a global alteration of membrane traffic. Activation of apical caspases is instrumental for promoting the dispersal of secretory organelles, since caspase inhibition blocks the outward movement of Golgi-related endomembranes and reduces their mixing with mitochondria. Caspase inhibition also blocks the FasL-induced secretion of intracellular proteases from lysosomal compartments, outlining a novel aspect of death receptor signalling via apical caspases. Thus, our work unveils that Fas ligand-mediated apoptosis induces scrambling of mitochondrial and secretory organelles via a global alteration of membrane traffic that is modulated by apical caspases.


Figures

Figure 1
Figure 1
Scrambling of Golgi and mitochondrial membranes after FasL treatment. (a) Activity of caspase-8 was measured in CEM cells by flow cytometry by using the CaspGLOW fluorescein active caspase staining (see Materials and Methods). The assay utilizes the specific caspase inhibitor IETD-FMK conjugated to FITC to label active caspase-8 within intact cells. The numbers into each panel refer to the percentage of cells displaying enhanced fluorescence attributed to active caspase-8. No significant increase in the basal level of apoptosis (<2% of cells) was detected by dual parametric analysis up to 1 h of treatment with FasL. (b) Three-colour immunofluorescence images of CEM cells untreated or treated with FasL (1 h as in a) were acquired with IVM technology, that is captured with a CCD camera and a × 100 objective, then processed for background using image analysis software (OPTILAB, Graftek, France). Nuclei were stained with the Hoechst dye, while Golgi staining was obtained with anti-GM130 monoclonal antibodies (red) and combined with mitochondrial staining (MTR Green, MTR). Note the yellow staining, indicating Golgi/mitochondria overlap, and the partial polarization of mitochondria in treated cells (second row). (c) TEM analysis of the same treated cells as in (b) revealed vesicular events promoted by FasL. Note the close contact between Golgi stalks and a mitochondrion (left panel), directional vesicle budding towards a mitochondrion (middle panel), and a small vesicle merging with a mitochondrion (right panel). Inset: high magnification (× 40 000) of the boxed area in the middle panel
Figure 2
Figure 2
Golgi membranes partially overlap with mitochondria after FasL treatment. (a) Jurkat cells were treated for 30 min (i) and then 60 min (ii) with FasL and labelled with diverse membrane markers after isotonic fractionation (cf.15). Global protein staining with India ink ensued equal loading (bottom panel in ii, right). (b) Projected images from 33 z-sections of 0.2 nm, obtained after 10 cycles of deconvolution (software Rx. 3.4.3, Applied Precision), were acquired by using a state-of-the art Deltavision RT system coupled to an automated Olympus IX71 microscope with a × 100 objective. Cells were first stained with 50 nM MTR red and then processed for ERGIC53 immunostaining. Note the clustering of this staining in untreated cells, reflecting the predominant association of ERGIC elements around the proximal Golgi. (c) Fluorescence deconvolution images of Jurkat cells before (control) and after FasL treatment for 1 h were acquired with Deltavision RT as in (b). Mitochondria were first stained with 50 nM MTR and then immunolabelled with a monoclonal anti-GM130 (BD Pharmingen). Projected images from 33 z-sections of 0.2 nm were obtained with 15 cycles of deconvolution, followed by computer-assisted colour splitting to evidence co-localization using the Deltavision RT software (set with a threshold value of 50 dpi – panels on the right). The insert in the bottom is a magnification of the boxed area in the merged image of dispersed Golgi staining
Figure 3
Figure 3
FasL induces global movements of endomembranes. (a) Dual Golgi staining was carried out using Alexa Fluor488-HPA (green) after ERGIC53 immunolabelling that, at difference with the images in Figure 2b, was evidenced using a red fluorescent secondary antibody. Projected images from 31 z-sections were acquired with a × 60 objective and deconvolved with 10 cycles of the Deltavision RT software. HPA staining was undertaken without lectin preabsorption for a neat definition of the cellular contour. Note the dispersal of this surface staining in the FasL-treated cell. (b) Texas-red-conjugated HPA (HPA external, 20 μg/ml) was added simultaneously with FasL (0.5 μg/ml) to live cells and incubated for 40 min in RB at 37°C. After washing, cells were fixed, permeabilized and then immunostained with GM130 (left) and ERGIC53 (right – merged images only) as in Figure 2c. Projected images from 34 z-sections were obtained as in (a). (c) Jurkat cells were first loaded with 50 nM MTR (cf. Figure 2), then centrifuged and attached to coverslips, fixed, quenched with unlabelled HPA (52 μg/ml), permeabilized and then stained with 2 μg/ml Alexa Fluor488-HPA (green) to reveal endocellular membranes in preference to surface staining (contrary to a). Projected images from 56 z-sections were obtained as in (a). (d) Quantitative measurement of HPA binding to membranes was carried out with mitochondria isolated from mouse liver, treated ex vivo with FasL (cf.38) under the same conditions as those used to induced cell death in lymphoma cells. Texas-red-conjugated HPA (50 μg/ml) was incubated with 40 μg/ml of mitochondrial protein and 8 μg/ml of Golgi protein (black histogram, purified Golgi from rat liver was a kind gift of Dr M Lowe, University of Manchester) for 30 min in assay buffer at 37°C. Membranes were then separated and washed by centrifugation, resuspended in assay buffer and transferred in quadruplicate wells for fluorescence measurements in a plate reader (excitation at 544 nm, emission at 590 nm)
Figure 4
Figure 4
Alteration of membrane traffic and effect of caspase inhibition. (a) Dual staining of mobile membrane elements was accomplished by incubating live cells with Texas-red-conjugated HPA (external, 20 μg/ml) simultaneously to FasL (0.5 μg/ml) as in Figure 3b. Aliquots of the same cells were incubated with 50 μM z-VAD prior to FasL addition. Subsequent to fixation, cells were quenched with unlabelled HPA (52 μg/ml), permeabilized and then stained with Alexa Fluor 488-HPA (static HPA, 2 μg/ml for 5 min). After washing and mounting, images were obtained with Deltavision RT deconvolution microscopy as in Figure 3c (from 40 to 60 z-sections). (b) Merged images were obtained at later time points in the same experiment as in (a) and derived from deconvolved projections of 34 z-sections. (c) Time-course of HPA uptake and staining of Jurkat cells in the absence and presence of FasL (as in a). Cells were incubated at 37°C in RB containing 10 μg/ml of Texas-red-conjugated HPA; at the indicated times, cells were centrifuged in the cold and resuspended in the same buffer without HPA. After counting, 40 000 cells of each sample were loaded in quadruplicate wells and measured for the retained fluorescence in a plate reader as in Figure 3d. Representative images of dual HPA staining as in (a) are inserted for the indicated times of incubation. Note the transient increase of HPA uptake within 1 h
Figure 5
Figure 5
Caspase modulation of subcellular changes in mitochondria and other organelles. (a) Single staining of GM130 was undertaken after 40 min of FasL treatment as in Figure 2c, also after preincubation with 50 μM z-VAD, but using red fluorescent secondary antibodies as in Figure 1b. Projected images from 35 z-sections were obtained as in Figure 3b. (b) Distribution of organelle markers in perinuclear mitochondria from cells treated with FasL for 1 h, also after preincubation with 50 μM z-VAD for 30 min. The bottom panels show reblots with marker proteins of the outer mitochondrial membrane. (c) Three-colour immunofluorescence images of cells equally treated with FasL (1 h) in the absence and presence of 50 μM IETD-CHO. IVM data were acquired as in Figure 1b
Figure 6
Figure 6
Secretion of lysosomal markers is accelerated by caspases during Fas signalling. (a) Jurkat cells were incubated for 15 min at 37°C in RB containing 10 μg/ml of BODIPY TR-conjugated casein, a fluorogenic substrate of proteases (EnzChek®31), then washed and chased in full growth medium for 1 h. After resuspension in RB, in the absence of presence of z-VAD (incubated for 20 min), cells were left untreated or treated with FasL for 1 h as in the experiment of Figure 5b. After fixation, cells were briefly stained with 2 μg/ml Alexa Fluor488-HPA (green) to evaluate surface changes. In untreated cells, EnzChek stained an array of peripheral and cortical granules (usually 6–8 per cell) that remained relatively stable after hours of chase and corresponded to secretory lysosomes (the bottom panel shows a representative image of control cells immediately after the chase). Fas-activation strongly decreased the number of these granules, whereas z-VAD inhibition of caspases restored their normal frequency and distribution. Deconvolved images were obtained from 54 z-sections as in Figure 3c. (b) Jurkat cells were double labelled with fluorogenic substrates of proteases. Staining with EzCheck was performed as in (a), but simultaneously with the uptake of 10 μM Rhodamine110-FR-bisamide, a fluorogenic substrate of cathepsin L. This substrate produced green fluorescence that was confined in a few small vacuoles, some of which co-localized with those labelled by EnzChek. Treatment with FasL for 1 h induced diffused green fluorescence within and outside the cells (left panel), in part due to cathepsin release from lysosomal compartments. However, pretreatment with z-VAD strongly reduced this diffusion of green fluorescence while increasing its focal concentration in vacuoles overlapping secretory lysosomes (right panel). Merged images were projections of 52 z-sections that had not been deconvolved, to better show the diffused pattern of green fluorescence. (c) Cells were incubated with EnzChek and then chased as in (a, b); after washing, they were resuspended at 2 × 10⁶/ml in RB and the fluorescence of intracellular EnzChek was continuously monitored at 24°C in a fluorimeter, subsequently to FasL addition (arrow). After 1 h, the same cells were centrifuged and their supernatant was supplemented with fresh EnzCheck (20 μg/ml) to measure the activity of released proteases (again at 24°C). Compared to control cells (not shown) or z-VAD-treated cells (middle trace), the supernatant of Fas-treated cells showed a strong increase in protease activity. The dotted line at the bottom represents the blank containing EnzChek alone. (d) Cathepsin L activity was measured in supernatants of cells treated with FasL for 45 min, in the absence and presence of z-VAD as in (b) (cf. Figure 4) using 1 μM Rhodamine110-FR-bisamide at 37°C and pH 6.0. Mean rates (n = 3) were measured using a plate reader as in Figure 4c. The histograms on the right show the strong decrease of activity measured in the presence of 5 μM E-64, a general inhibitor of cathepsins

References

    1. Peter ME, Krammer PH. The CD95(APO-1/Fas) DISC and beyond. Cell Death Differ. 2003;10:26–35. - PubMed
    1. Chipuk JE, Green DR. Do inducers of apoptosis trigger caspase-independent cell death? Nat Rev Mol Cel Biol. 2005;6:268–275. - PubMed
    1. Algeciras-Schimnich A, Shen L, Barnhart BC, Murmann AE, Burkhardt JK, Peter ME. Molecular ordering of the initial signaling events of CD95. Mol Cell Biol. 2002;22:207–220. - PMC - PubMed
    1. Lee KH, Feig C, Tchikov V, Schickel R, Hallas C, Schutze S, et al. The role of receptor internalization in CD95 signaling. EMBO J. 2006;25:1009–1023. - PMC - PubMed
    1. Cristea IM, Degli Esposti M. Membrane lipids and cell death: an overview. Chem Phys Lipids. 2004;129:133–160. - PubMed

Publication types