. 2007 May 1;97(1):118-37.
doi: 10.1002/bit.21200.

Contribution of gene expression to metabolic fluxes in hypermetabolic livers induced through burn injury and cecal ligation and puncture in rats

Affiliations

Contribution of gene expression to metabolic fluxes in hypermetabolic livers induced through burn injury and cecal ligation and puncture in rats

Scott Banta et al. Biotechnol Bioeng. .

Abstract

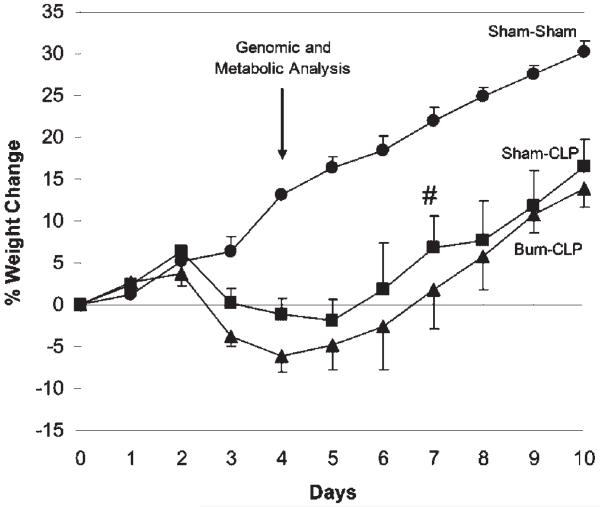
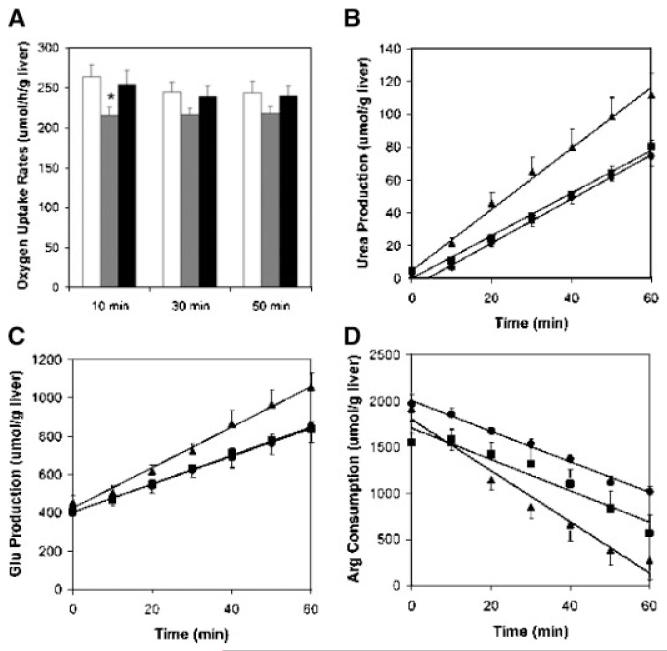
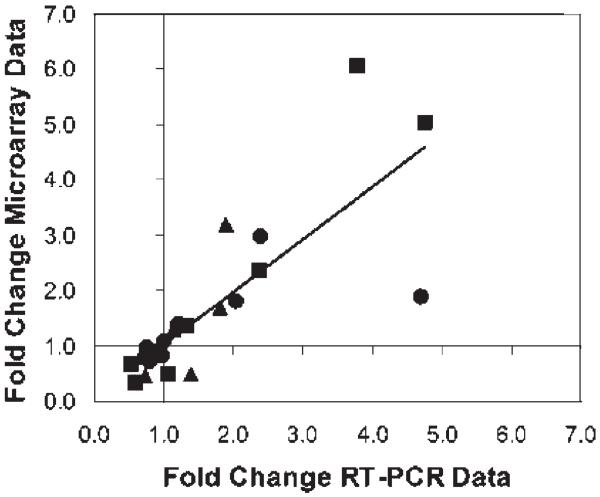
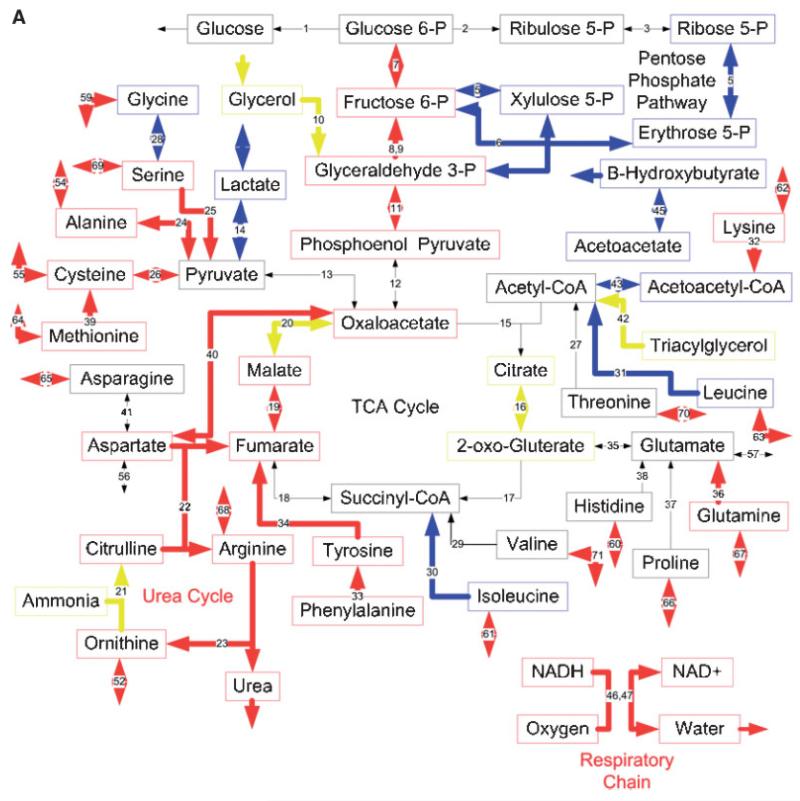
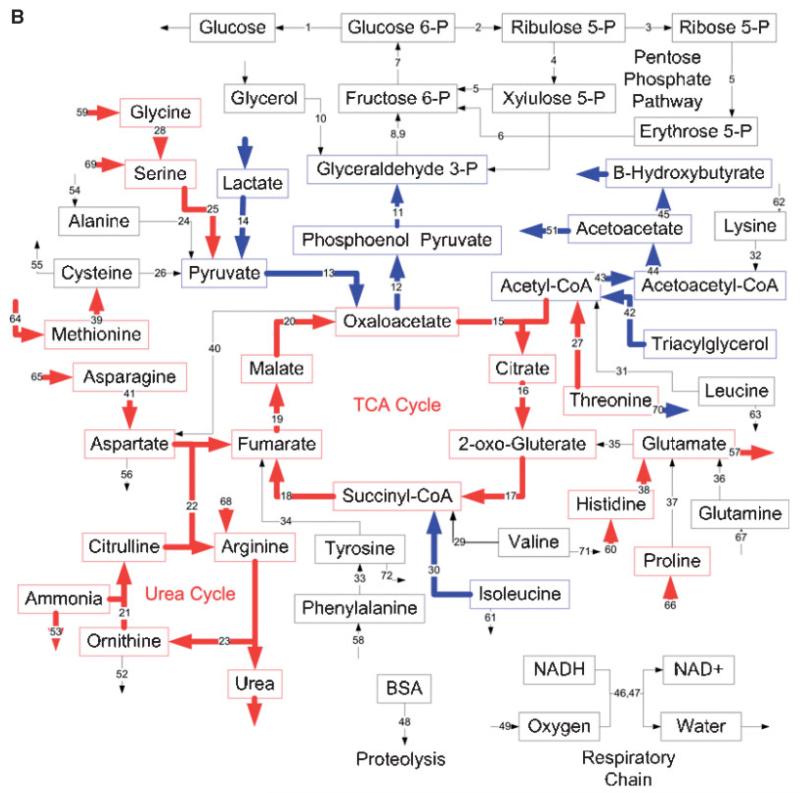
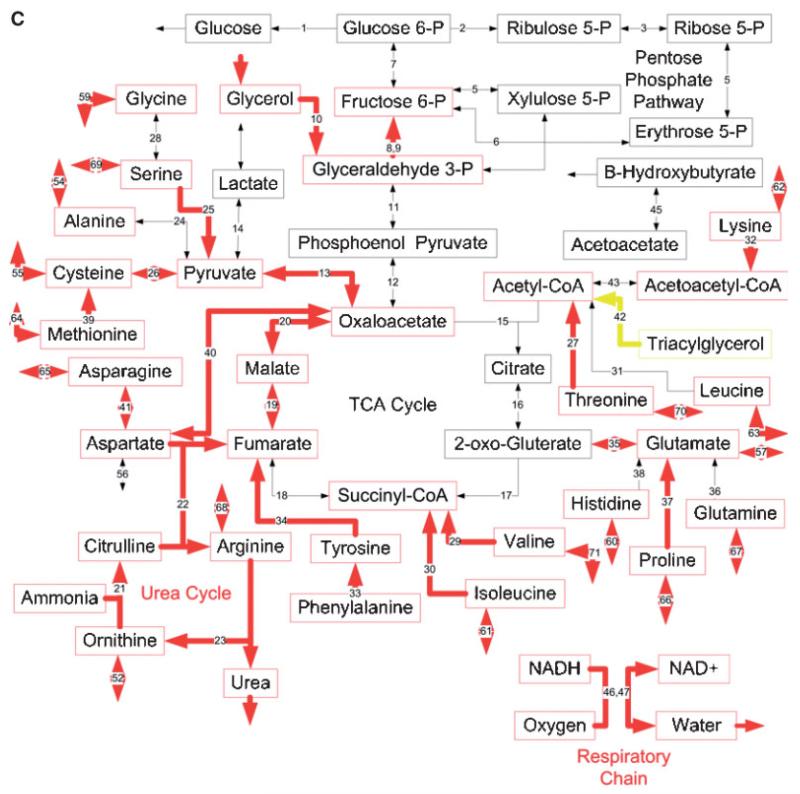
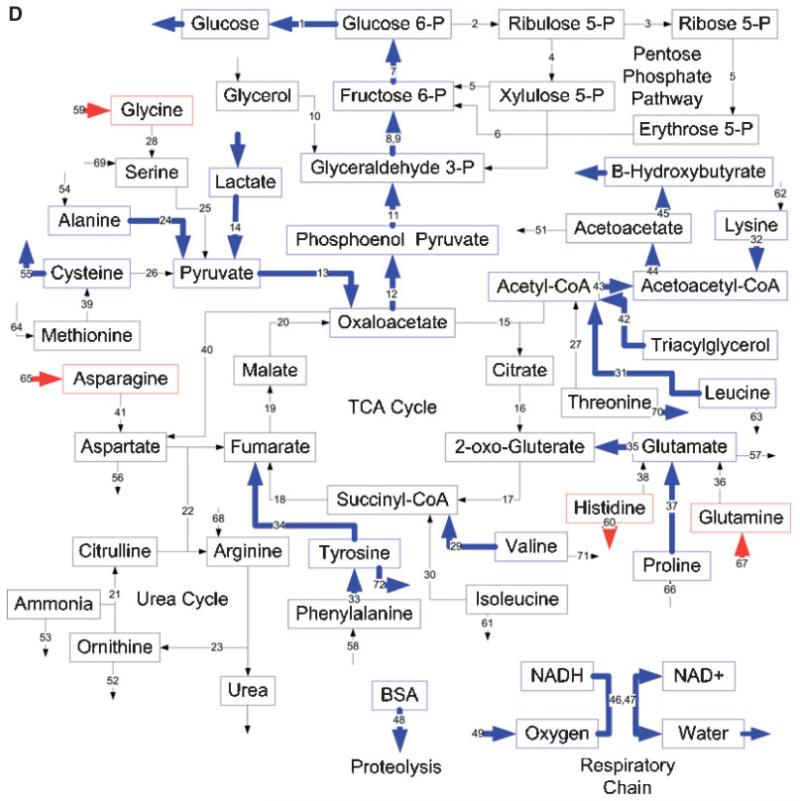
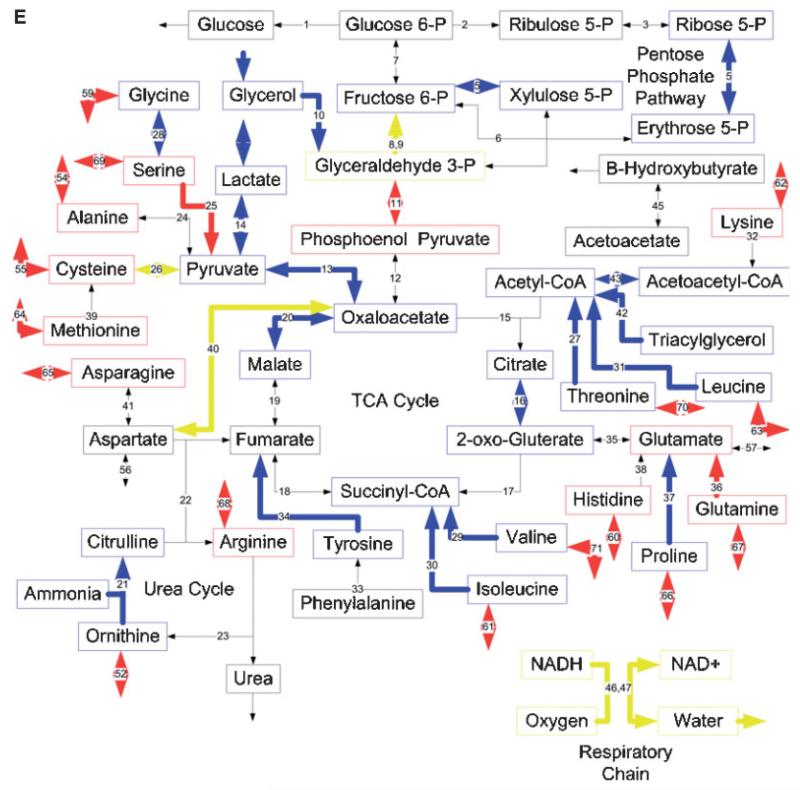
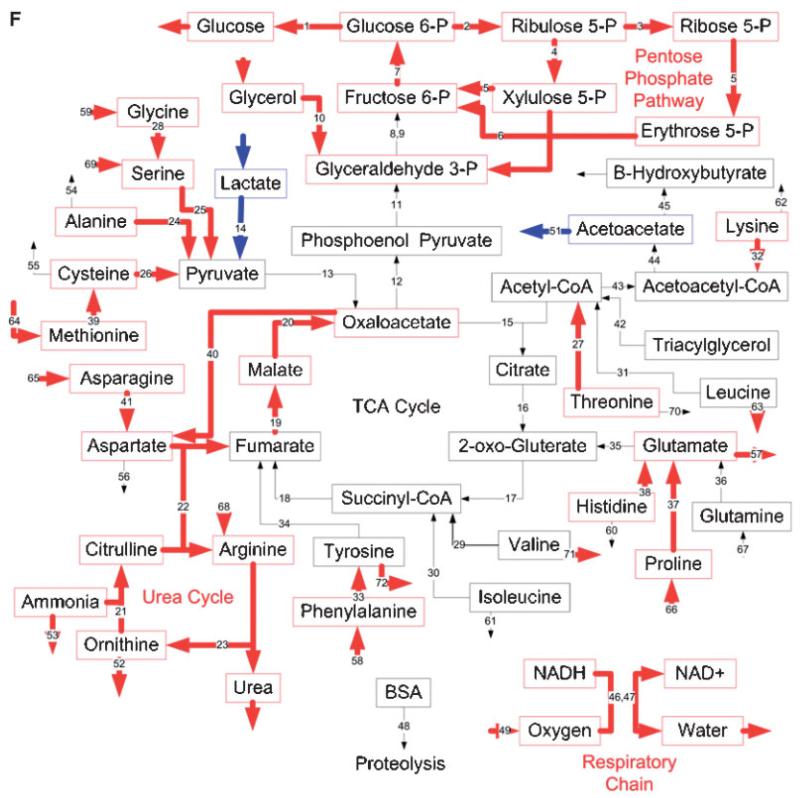
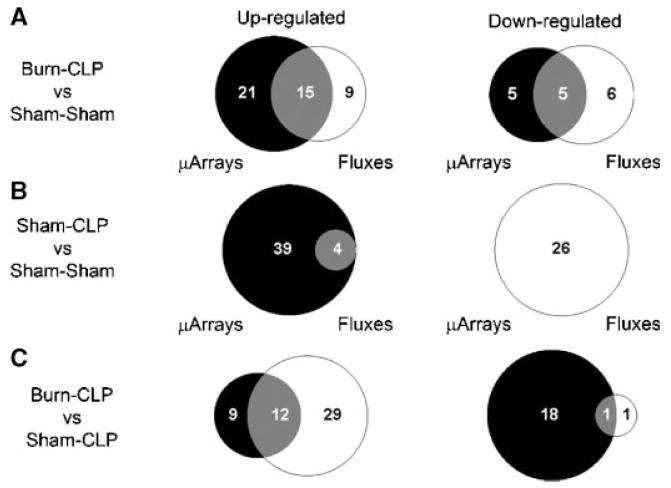
Severe injury activates many stress-related and inflammatory pathways that can lead to a systemic hypermetabolic state. Prior studies using perfused hypermetabolic rat livers have identified intrinsic metabolic flux changes that were not dependent upon the continual presence of elevated stress hormones and substrate loads. We investigated the hypothesis that such changes may be due to persistent alterations in gene expression. A systemic hypermetabolic response was induced in rats by applying a moderate burn injury followed 2 days later by cecum ligation and puncture (CLP) to produce sepsis. Control animals received a sham-burn followed by CLP, or a sham-burn followed by sham-CLP. Two days after CLP, livers were analyzed for gene expression changes using DNA microarrays and for metabolism alterations by ex vivo perfusion coupled with Metabolic Flux Analysis. Burn injury prior to CLP increased fluxes while decreases in gene expression levels were observed. Conversely, CLP alone significantly increased metabolic gene expression, but decreased many of the corresponding metabolic fluxes. Burn injury combined with CLP led to the most dramatic changes, where concurrent changes in fluxes and gene expression levels occurred in about 1/3 of the reactions. The data are consistent with the notion that in this model, burn injury prior to CLP increased fluxes through post-translational mechanisms with little contribution of gene expression, while CLP treatment up-regulated the metabolic machinery by transcriptional mechanisms. Overall, these data show that mRNA changes measured at a single time point by DNA microarray analysis do not reliably predict metabolic flux changes in perfused livers.


Figures

Figure 1
Figure 1
Average percent weight changes following Sham-Sham (●), Sham-CLP (■), and Burn-CLP (▲) treatment. On post-burn day 7, two Sham-CLP rats died (#). n = 6 for all groups. Weights for the Sham-CLP and Burn-CLP groups were significantly different from the Sham-Sham controls starting on post-burn day 3 until the end of the experiment. The liver perfusions and microarray analyses were performed on post-burn day 4, as shown by the arrow.
Figure 2
Figure 2
Examples of averaged measured metabolic flux data across the perfused livers. Error bars represent ± SE, and n 6 for all measurements. A: Oxygen uptake rates measured at 10, 30, and 50 min into the liver perfusions for the Sham-Sham (white), Sham-CLP (gray), and Burn-CLP (black) groups.=There was not statistically significant difference between time points for any of the groups. At 10 min, the Sham-CLP oxygen uptake rate was statistically significantly lower than the Sham-Sham oxygen uptake rate (marked by *P < 0.05). B: Urea production by the perfused livers from the Sham-Sham (●), Sham-CLP (■), and Burn-CLP(▲) groups. C: Glutamate production by the perfused livers from the Sham-Sham (●), Sham-CLP (■), and Burn-CLP(▲) groups. D: Arginine uptake by the perfused livers from the Sham-Sham (●), Sham-CLP (■), and Burn-CLP(▲) groups. The concentrations were normalized to the weights of the perfused livers. The best-fit lines to the averaged data are shown, and the slope is used to obtain the metabolic flux.
Figure 3
Figure 3
Comparison of Microarray and RT-PCR data. The fold-differences between RT-PCR data from Table V are compared to the fold-difference values calculated from the DNA microarray data in Table IV. Sham-CLP versus Sham-Sham (●), Burn-CLP versus Sham-Sham (■), and Burn-CLP versus Sham-CLP (▲) comparisons are indicated. Values of fold-difference greater than 1.0 show up-regulation while values less than 1.0 indicate down-regulation. The best-fit line for all of the data combined has a slope of 0.95.
Figure 4
Figure 4
Effects of burn injury and CLP on the gene expression pattern and metabolic fluxes in the rat liver. A and B: Comparison between the Burn-CLP versus Sham-Sham groups using the DNA microarray and metabolic flux data, respectively. C and D: Comparison between the Sham-CLP versus Sham-Sham groups using the DNA microarray and metabolic flux data, respectively. E and F: Comparison between the Burn-CLP versus Sham-CLP groups using the DNA microarray and metabolic flux data, respectively. In panels A, C, and E, arrows in red indicate increased gene expression, blue indicates decreased gene expression, and yellow indicates mixed results. (“Mixed results” means that several genes on the array correspond to that particular pathway and changed in opposite directions.) In panels B, D, and F, arrows in red indicate increased metabolic flux, and blue indicates decreased metabolic flux.
Figure 4
Figure 4
Effects of burn injury and CLP on the gene expression pattern and metabolic fluxes in the rat liver. A and B: Comparison between the Burn-CLP versus Sham-Sham groups using the DNA microarray and metabolic flux data, respectively. C and D: Comparison between the Sham-CLP versus Sham-Sham groups using the DNA microarray and metabolic flux data, respectively. E and F: Comparison between the Burn-CLP versus Sham-CLP groups using the DNA microarray and metabolic flux data, respectively. In panels A, C, and E, arrows in red indicate increased gene expression, blue indicates decreased gene expression, and yellow indicates mixed results. (“Mixed results” means that several genes on the array correspond to that particular pathway and changed in opposite directions.) In panels B, D, and F, arrows in red indicate increased metabolic flux, and blue indicates decreased metabolic flux.
Figure 5
Figure 5
Semi-quantitative Venn diagrams showing the overlap between the MFA and DNA microarray results described in Figure 4. The left hand column shows the number of pathways that were up-regulated based on gene expression (black) or metabolic fluxes (white). The right hand column shows the number of pathways that were down-regulated based on gene expression (black) or metabolic fluxes (white). The overlap areas show the number of pathways that had consistent changes in gene expression and metabolic flux (i.e. both up-regulated or both down-regulated). A: Burn-CLP versus Sham-Sham. B: Sham-CLP versus Sham-Sham. C: Burn-CLP versus Sham-CLP. In cases of mixed microarray results, (for example, respiratory chain enzymes in Fig. 4E), the pathway under consideration was assigned to the “up-regulated” or “down-regulated” category based on whether the largest number of genes on the microarray chip relevant to that pathway were up- or down-regulated.

Similar articles

Cited by

References

    1. Anderson L, Seilhamer J. A comparison of selected mRNA and protein abundances in human liver. Electrophoresis. 1997;18(3-4):533–537. - PubMed
    1. Arai K, Lee K, Berthiaume F, Tompkins RG, Yarmush ML. Intrahe-patic amino acid and glucose metabolism in a D-galactosamine-induced rat liver failure model. Hepatology. 2001;34(2):360–371. - PubMed
    1. Aulak KS, Miyagi M, Yan L, West KA, Massillon D, Crabb JW, Stuehr DJ. Proteomic method identifies proteins nitrated in vivo during inflammatory challenge. Proc Natl Acad Sci USA. 2001;98(21):12056–12061. - PMC - PubMed
    1. Banta S, Yokoyama T, Berthiaume F, Yarmush ML. Quantitative effects of thermal injury and insulin on the metabolism of the skeletal muscle using the perfused rat hindquarter preparation. Biotechnol Bioeng. 2004;88(5):613–629. - PubMed
    1. Banta S, Yokoyama T, Berthiaume F, Yarmush ML. Effects of dehydroepiandrosterone administration on rat hepatic metabolism following thermal injury. J Surg Res. 2005;127(2):93–105. - PubMed

Publication types