Comparative Study
. 2006 Sep 29;2(9):e152.
doi: 10.1371/journal.pgen.0020152. Epub 2006 Aug 2.

Analysis of pleiotropic transcriptional profiles: a case study of DNA gyrase inhibition

Affiliations
Comparative Study

Analysis of pleiotropic transcriptional profiles: a case study of DNA gyrase inhibition

Kyeong Soo Jeong et al. PLoS Genet. .

Abstract

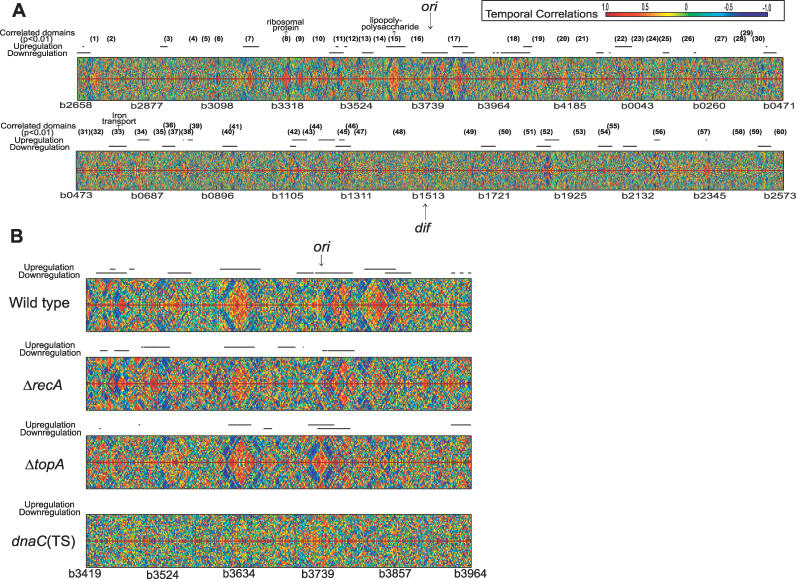
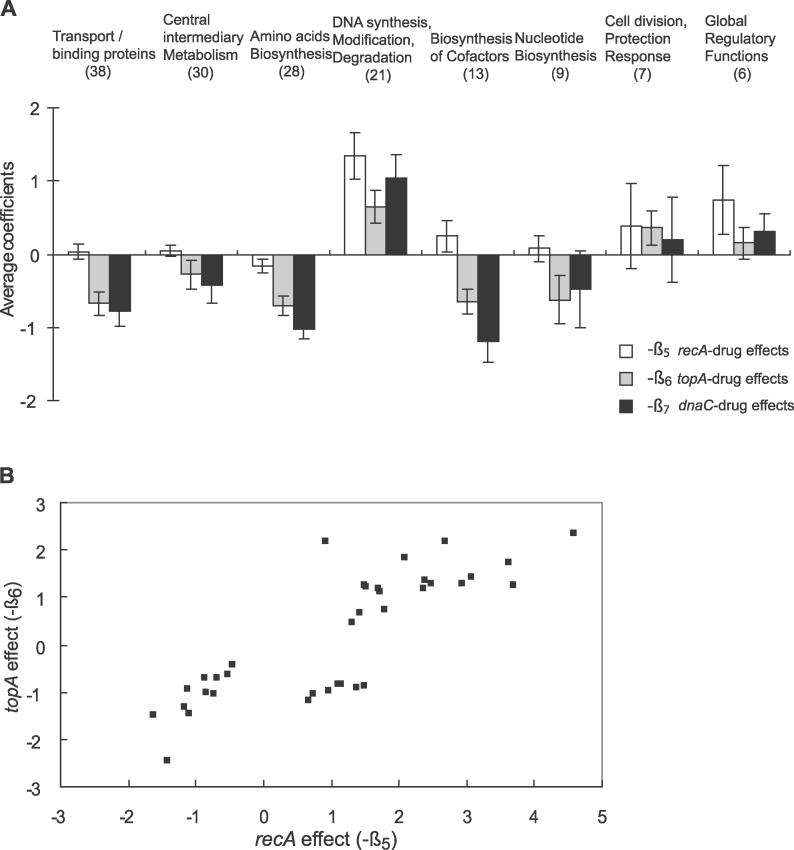
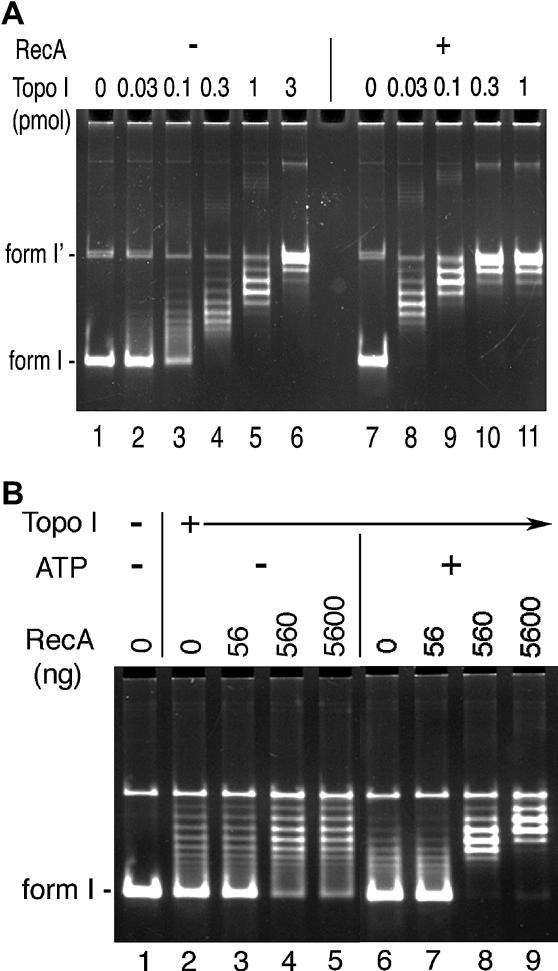
Genetic and environmental perturbations often result in complex transcriptional responses involving multiple genes and regulons. In order to understand the nature of a response, one has to account for the contribution of the downstream effects to the formation of a response. Such analysis can be carried out within a statistical framework in which the individual effects are independently collected and then combined within a linear model. Here, we modeled the contribution of DNA replication, supercoiling, and repair to the transcriptional response of inhibition of the Escherichia coli gyrase. By representing the gyrase inhibition as a true pleiotropic phenomenon, we were able to demonstrate that: (1) DNA replication is required for the formation of spatial transcriptional domains; (2) the transcriptional response to the gyrase inhibition is coordinated between at least two modules involved in DNA maintenance, relaxation and damage response; (3) the genes whose transcriptional response to the gyrase inhibition does not depend on the main relaxation activity of the cell can be classified on the basis of a GC excess in their upstream and coding sequences; and (4) relaxation by topoisomerase I dominates the transcriptional response, followed by the effects of replication and RecA. We functionally tested the effect of the interaction between relaxation and repair activities, and found support for the model derived from the microarray data. We conclude that modeling compound transcriptional profiles as a combination of downstream transcriptional effects allows for a more realistic, accurate, and meaningful representation of the transcriptional activity of a genome.


Conflict of interest statement

Competing interests. The authors have declared that no competing interests exist.

Figures

Figure 1
Figure 1. Spatial Correlations of Temporal Transcriptional Profiles Elicited by Gyrase Inhibition
Temporal transcriptional profiles observed in the wild-type (A) and isogenic mutant strains (B). Pair-wise correlations of temporal transcript profiles of 4,000 genes, arranged in the chromosomal order, are shown on a colorimetric scale for the whole chromosome (A) and the oriC proximal region (B). For spatial correlations around the n-th gene (n on the x-axis) in the chromosomal order, each y-axis includes 20 Pearson correlations of temporal profile pairs, (n − 1, n + 1), (n − 2, n +2),...(n − 19, n + 19), and (n − 20, n + 20). Chromosomal regions with high correlations exhibit symmetric red (positive) or blue (negative) triangles. Differentially expressed genes were significantly enriched in the regions marked with horizontal bars. The regions in which at least 16 consecutive genes show significant high correlations are enumerated. The statistical significance is estimated by the comparison with 5,000 randomly sampled subsets of temporal profiles.
Figure 2
Figure 2. SOM Analysis of Temporal Transcriptional Profiles
U-matrix (left side of panel) and weight vectors (right side of panel) of a self-organizing feature map of temporal transcriptional profiles observed after the addition of norfloxacin to the wild-type (A), recA (B), topA (C), or dnaC(Ts) (D) mutant. Transcript levels measured at 5, 10, 15, and 20 min of the treatment were compared with those of the non-treated cells (0 min; first time point) for 1,109 genes that showed differential expression in at least one strain. Each contoured hexagon (left side of panel) has a corresponding weight vector that represents temporal responses (0 to 20 min, right side of panel). Small hexagons indicate map units that are colored according to the medians of the surrounding hexagon with a contour line passing through.
Figure 3
Figure 3. Average Coefficients of Gene–Drug Interactions
The β5, β6, and β7 values in different functional groups (A) and association between the recA and topA mutation effects (B) are shown. (A) For the sake of convenience, the average coefficients are shown with opposite signs (−β5 , −β6, and −β7), so that the positive values indicate the increase in transcript levels and the negative indicates the decrease. The number of genes in each functional group is in parenthesis, and the error bars represent two standard errors. (B) The interactions between the recA–drug (−β5) and topA–drug (−β6) effects can be seen as the positive correlations for 36 selected genes (r = 0.82; p < 0.1 in both −β5 and −β6).
Figure 4
Figure 4. Comparison of the GC Content in Upstream and Coding Regions of Activated and Repressed Genes
(A) The GC content of the DNA regions from −2,000 to +1,500 nt, relative to the translation start site, of 84 activated (red) and 95 repressed (blue) genes was calculated with a 100-nt moving window (black: the average GC content of the genome). The significance of the GC content differences in a given region was determined by comparing the average GC content of the repressed genes with the GC content of 10,000 randomly sampled sets of similar fragments in the genome. (B) DNA windows, from 1 nt to 500 nt, were compared to assess their GC content in −500-nt upstream regions. The p-values were determined by comparing the averages of the maximal GC content values of the activated (red square), or repressed (blue triangle), genes with the corresponding values of 10,000 randomly sampled sets from the whole genome.
Figure 5
Figure 5. Effect of RecA on the Topo I-Catalyzed Relaxation Reaction
(A) DNA relaxation reaction catalyzed by Topo I in the presence of RecA. The substrate (lanes 1 and 7), cccDNA of pBR322, was incubated with increasing amounts of Topo I in the absence (lanes: 2–6) or presence of 5,600 ng (3 nt per RecA monomer) of RecA (lanes: 8–11) at 37 °C for 30 min and resolved on the vertical agarose gel as described in Materials and Methods. (B) ATP-dependence of the RecA effect. The substrate plasmid DNA (lane: 1) was incubated with 0.1 pmol of Topo I and the indicated amounts of RecA in the absence (lanes: 2–5) or presence of ATP (lanes: 6–9).

References

    1. Funnell BE, Baker TA, Kornberg A. Complete enzymatic replication of plasmids containing the origin of the Escherichia coli chromosome. J Biol Chem. 1986;261:5616–5624. - PubMed
    1. Steck TR, Drlica K. Bacterial chromosome segregation: Evidence for DNA gyrase involvement in decatenation. Cell. 1984;36:1081–1088. - PubMed
    1. Drlica K, Zhao X. DNA gyrase, topoisomerase IV, and the 4-quinolones. Microbiol Mol Biol Rev. 1997;61:377–392. - PMC - PubMed
    1. Khodursky AB, Peter BJ, Schmid MB, DeRisi J, Botstein D, et al. Analysis of topoisomerase function in bacterial replication fork movement: use of DNA microarrays. Proc Natl Acad Sci U S A. 2000;97:9419–9424. - PMC - PubMed
    1. Peter BJ, Arsuaga J, Breier AM, Khodursky AB, Brown PO, et al. Genomic transcriptional response to loss of chromosomal supercoiling in Escherichia coli . Genome Biol. 2004;5:R87. - PMC - PubMed

Publication types

MeSH terms

Associated data