. 2006;5(6):20.
doi: 10.1186/jbiol42.

High-resolution quantitative imaging of mammalian and bacterial cells using stable isotope mass spectrometry

Affiliations

High-resolution quantitative imaging of mammalian and bacterial cells using stable isotope mass spectrometry

Claude Lechene et al. J Biol. 2006.

Abstract

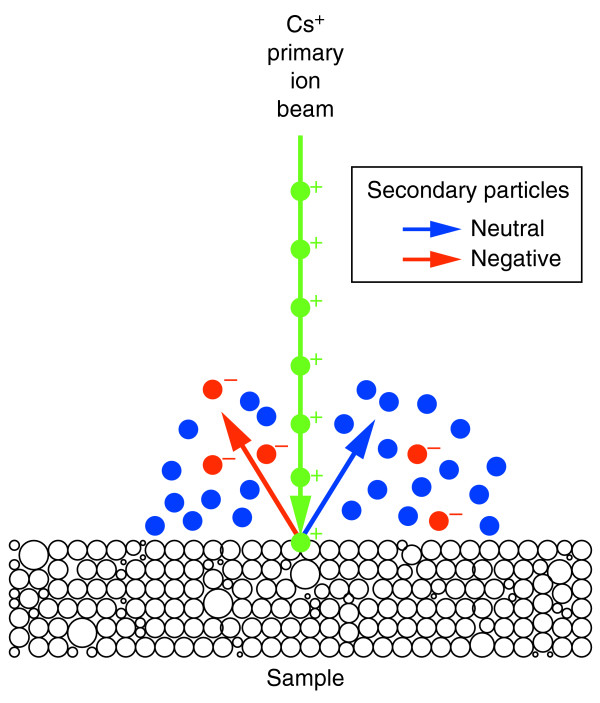
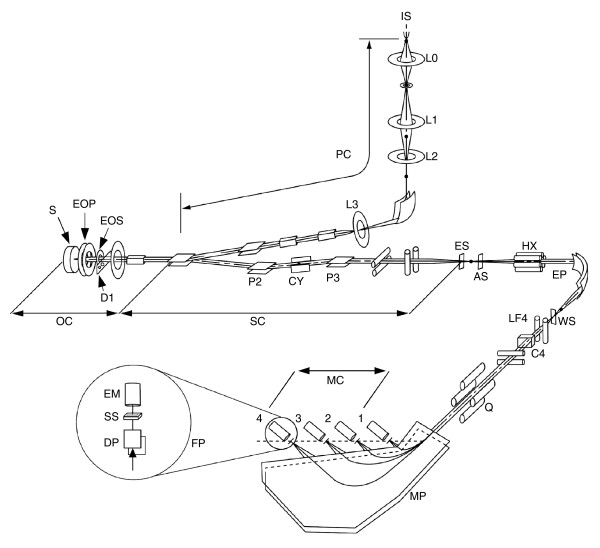
Background: Secondary-ion mass spectrometry (SIMS) is an important tool for investigating isotopic composition in the chemical and materials sciences, but its use in biology has been limited by technical considerations. Multi-isotope imaging mass spectrometry (MIMS), which combines a new generation of SIMS instrument with sophisticated ion optics, labeling with stable isotopes, and quantitative image-analysis software, was developed to study biological materials.

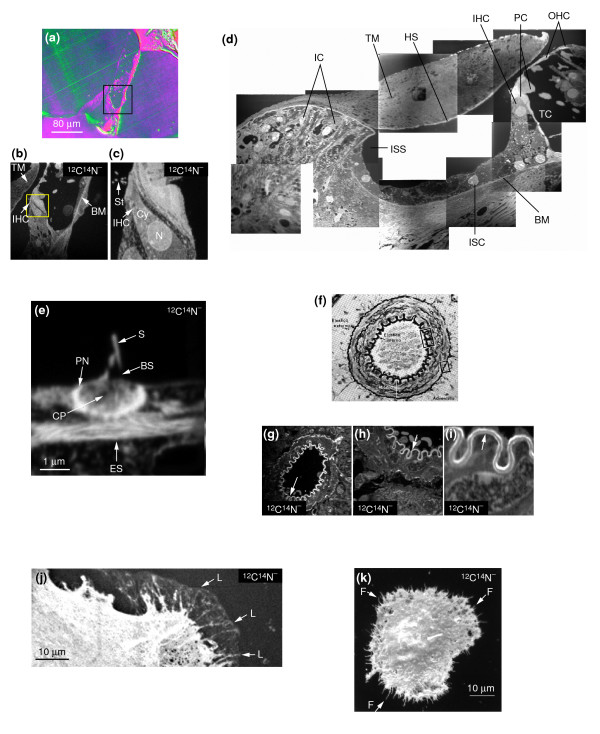
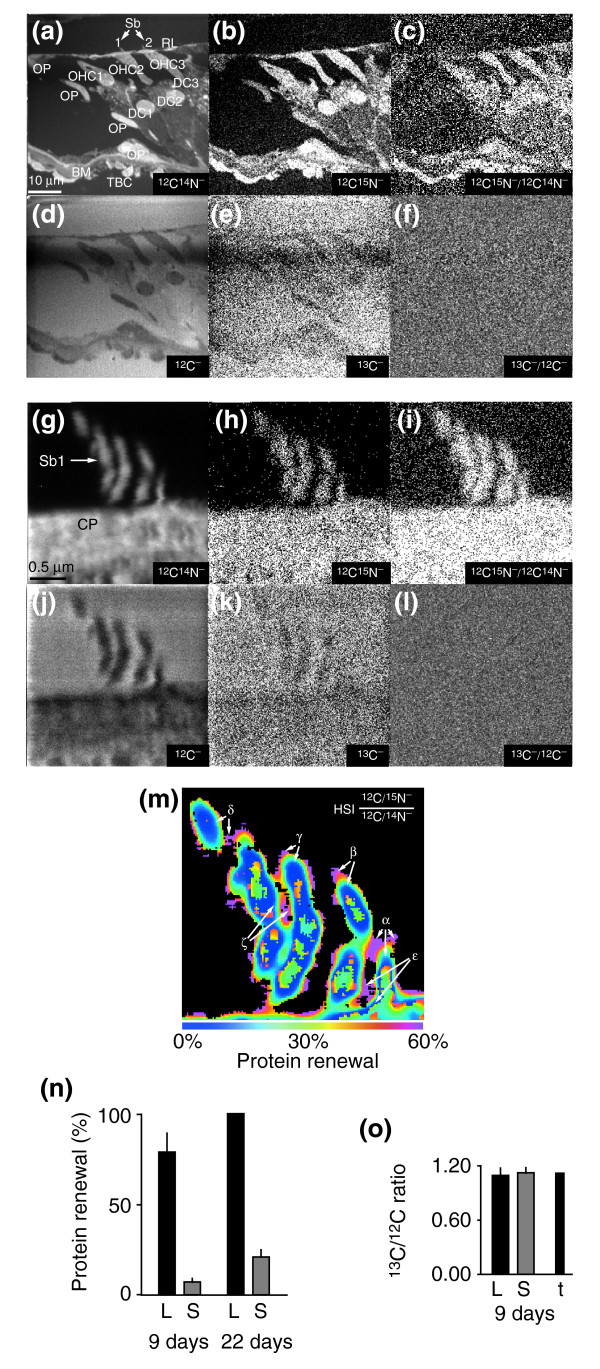
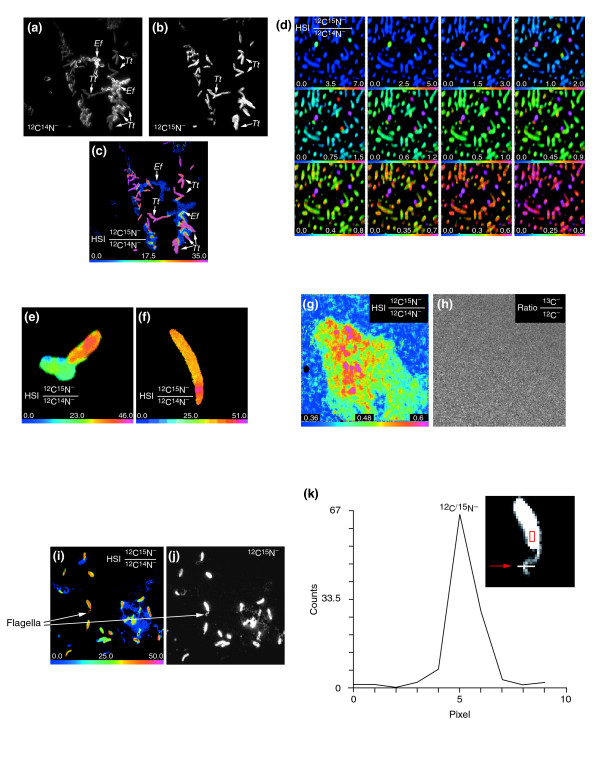
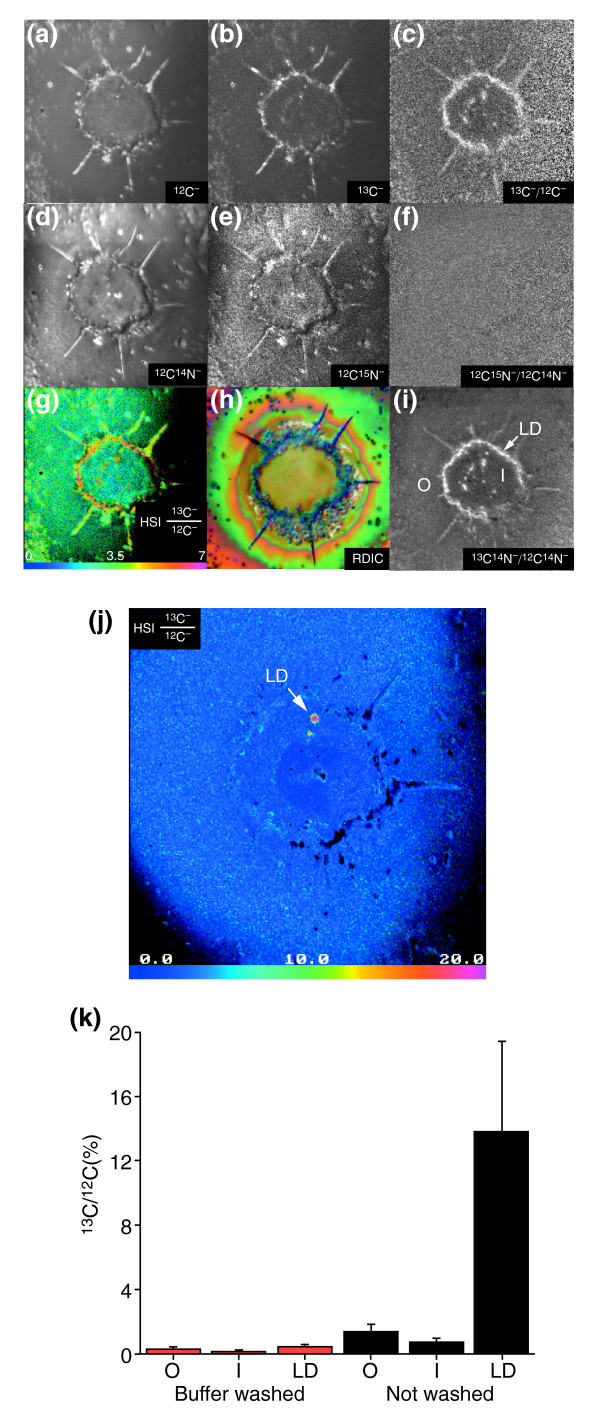
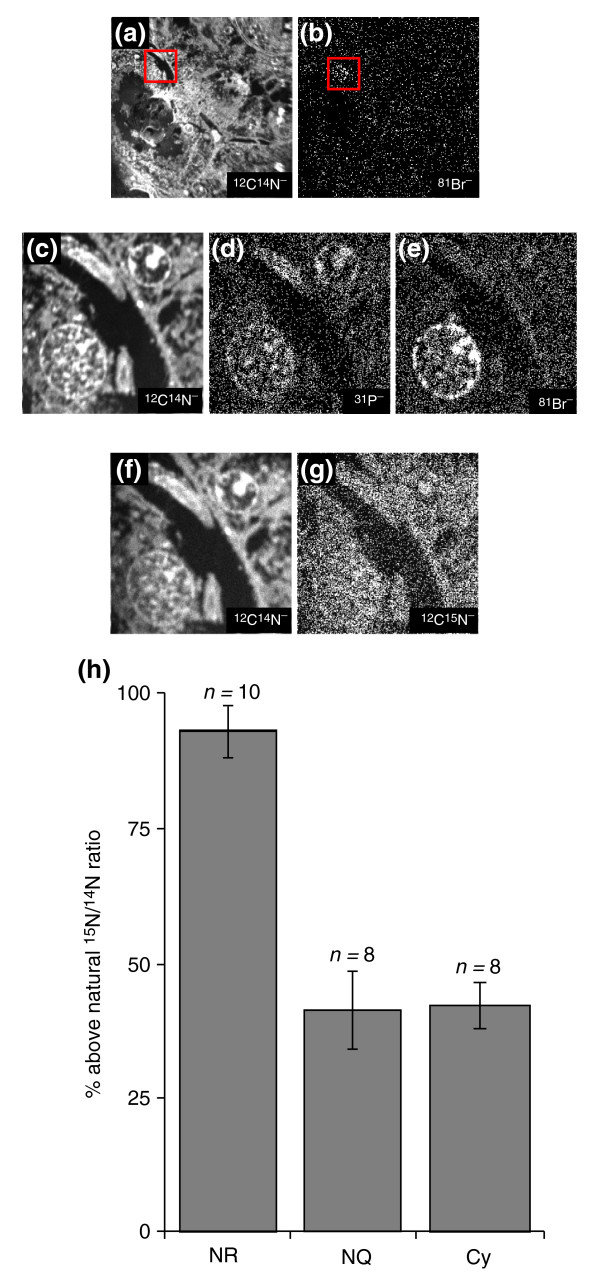
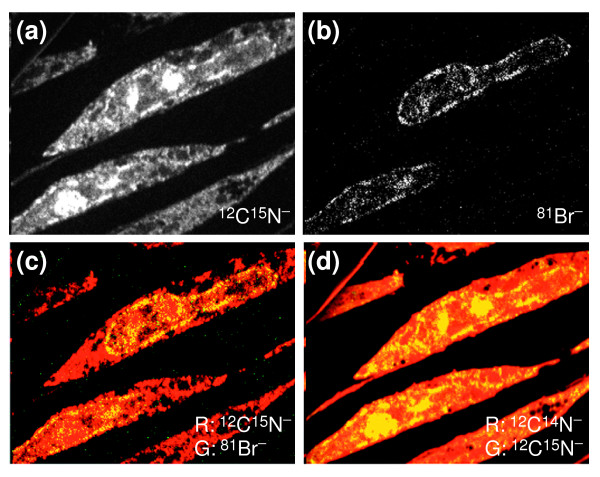
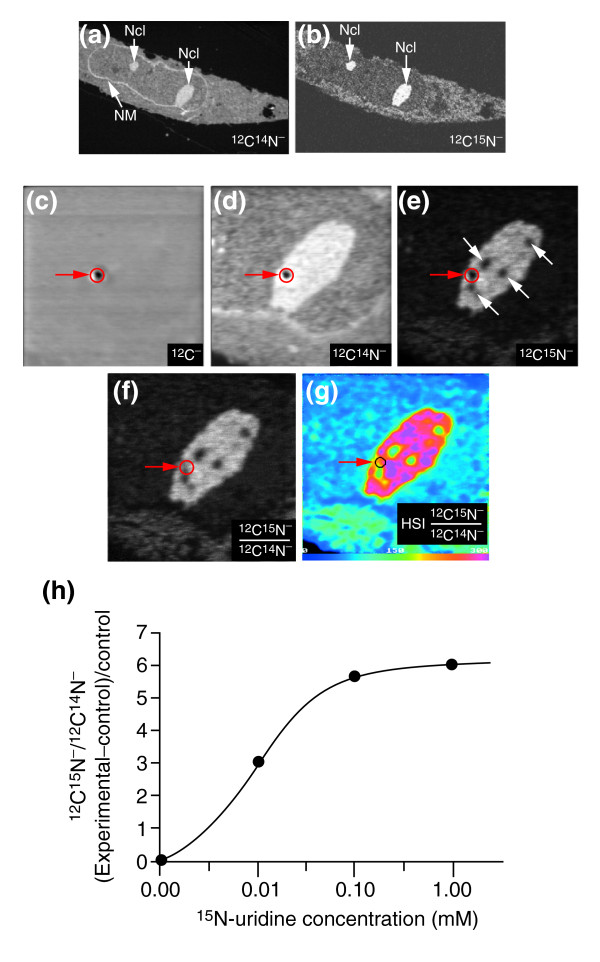
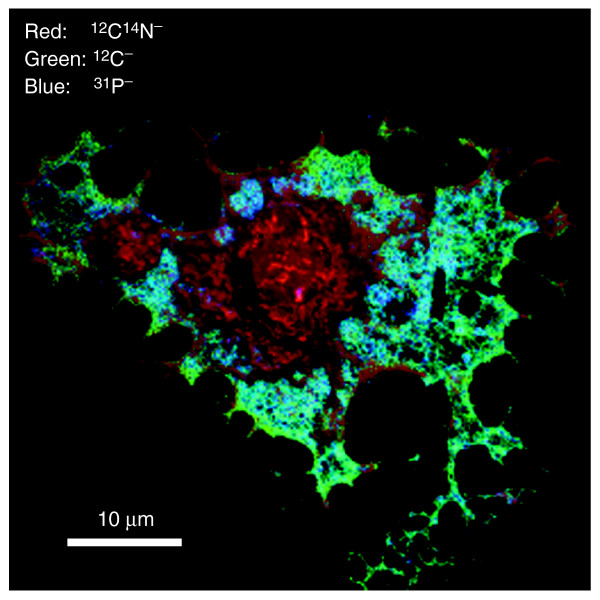
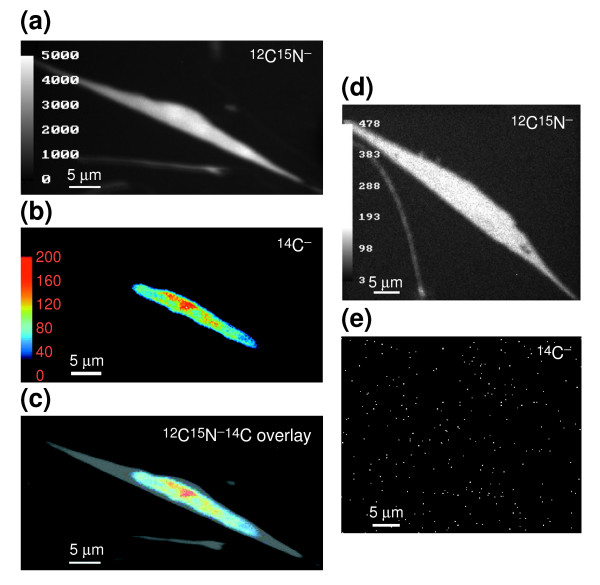
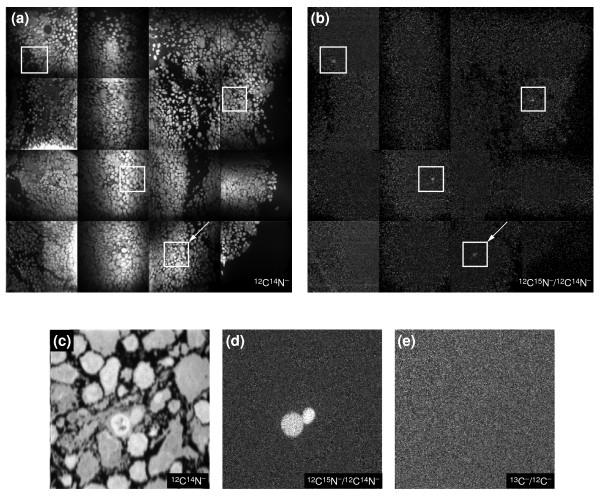
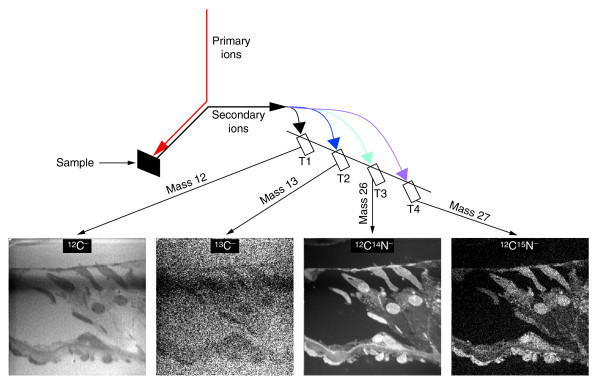
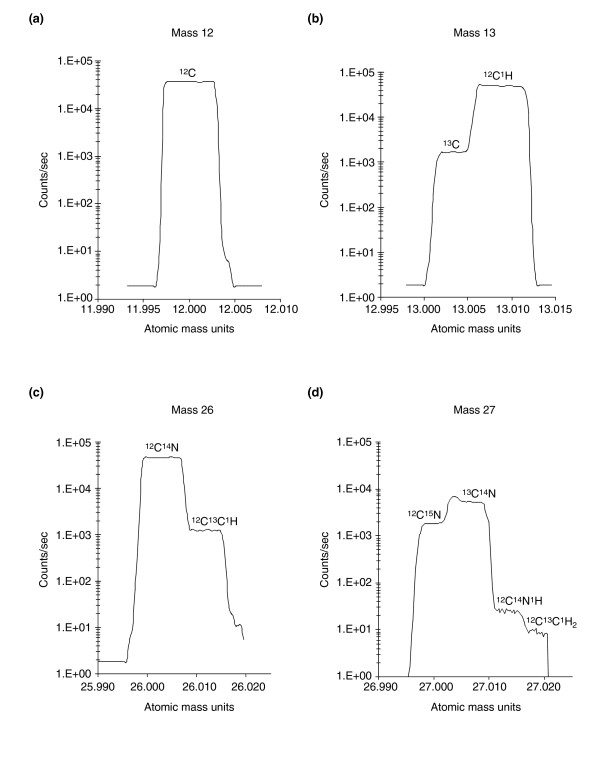
Results: The new instrument allows the production of mass images of high lateral resolution (down to 33 nm), as well as the counting or imaging of several isotopes simultaneously. As MIMS can distinguish between ions of very similar mass, such as 12C15N- and 13C14N-, it enables the precise and reproducible measurement of isotope ratios, and thus of the levels of enrichment in specific isotopic labels, within volumes of less than a cubic micrometer. The sensitivity of MIMS is at least 1,000 times that of 14C autoradiography. The depth resolution can be smaller than 1 nm because only a few atomic layers are needed to create an atomic mass image. We illustrate the use of MIMS to image unlabeled mammalian cultured cells and tissue sections; to analyze fatty-acid transport in adipocyte lipid droplets using 13C-oleic acid; to examine nitrogen fixation in bacteria using 15N gaseous nitrogen; to measure levels of protein renewal in the cochlea and in post-ischemic kidney cells using 15N-leucine; to study DNA and RNA co-distribution and uridine incorporation in the nucleolus using 15N-uridine and 81Br of bromodeoxyuridine or 14C-thymidine; to reveal domains in cultured endothelial cells using the native isotopes 12C, 16O, 14N and 31P; and to track a few 15N-labeled donor spleen cells in the lymph nodes of the host mouse.

Conclusion: MIMS makes it possible for the first time to both image and quantify molecules labeled with stable or radioactive isotopes within subcellular compartments.


Figures

Figure 1
Figure 1
The principle of secondary-ion mass spectrometry. The primary Cs+ beam hits the sample and sputters the surface. Atoms and molecular fragments are ejected from the sample surface; during this process a fraction of the secondary particles are ionized. The identity of the secondary particles, determined by mass spectrometry, indicates the atoms or atomic clusters from the molecules in the sample that have been hit by the primary Cs+ beam. The figure shows only the types of atoms and ions that are relevant to this article; other particles formed by sputtering are not represented. Cs, cesium.
Figure 2
Figure 2
Imaging sections and whole cells with MIMS. (a-c) A 0.5-μm epon section of a mouse cochlea mounted on silicon. BM, basilar membrane; Cy, cytoplasm; IHC, inner hair cell; N, nucleus; St, stereocilia; TM, tectorial membrane. (a) Image obtained by reflection differential interference contrast microscopy (RDIC). Scale bar = 80 μm. The boxed area corresponds to the field analyzed with MIMS in (b). (b) MIMS analysis of the same section (80 μm across) at mass 12C14N; acquisition time 1 min. The boxed area corresponds to the field analyzed at higher resolution in (c). (c) A higher-magnification image of a 20-μm wide part of (b); acquisition time 10 min. (d) A mosaic image of a mouse cochlea, compiled from ten individual tiled 12C14N- mass images. BM, basilar membrane; HS, Hensen's stripe; IC, interdental cells; IHC, inner hair cell; ISC, inner sulcus cell; ISS, inner spiral sulcus; OHC, outer hair cells; PC, pillar cells; TC, tunnel of Corti; TM, tectorial membrane. Acquisition time 2 min per tile. (e) High spatial resolution mass image of stereocilia. BS, base of stereocilium; CP, cuticular plate; ES, an elongated structure that is not visible by optical or electron microscopy; PN, pericuticular necklace; S, stereocilium. Scale bar = 1 μm. Conditions of MIMS analysis: beam current 0.4 pA; beam diameter 100 nm; field 6 × 6 μm; 256 × 256 pixels; 18 msec/pixel. For further details see Additional data file 7. (f) Reference photomicrograph of a muscular artery from the rat stained with aldehyde-fuchsin. Original magnification 52× [45]. (g-i) Contrast formation in an image of a mouse kidney artery. 12C14N- MIMS images at successively greater magnification, showing a brightly contrasting structure at the location of and with the appearance of the elastica interna. Image sizes: (g) 60 μm; (h) 30 μm; (i) 8 μm. Acquisition times: (g) 1 min; (h) 20 min; (i) 10 min. (j,k) Visualizing whole cells. (j) The surface of an untreated endothelial cell (72 μm × 28 μm, 10 min) and (k) endothelial cell after treatment with cytochalasin D (60 μm square, 10 min). L, lamellipodium; F, retraction fibers. Scale bars = (j,k) 10 μm.
Figure 3
Figure 3
MIMS analysis of stereocilia from mice fed 15N-L-leucine. (a-f) Quantitative MIMS images of cochlear hair cells from mice after 9 days on the 15N-L-leucine diet. DC, Deiter cells; OP, outer pillar cells; RL, reticular lamina; TBC, tympanic border cells (below the basilar membrane); Sb1 and Sb2, stereocilia bundles; other abbreviations are as in Figure 2. All images are 60 × 60 μm (256 × 256 pixels) and have an acquisition time of 10 msec/pixel. (a) 12C14N-, (b) 12C15N-, (c) 12C15N-/12C14N- ratio image, (d) 12C-, (e) 13C-, (f) 13C-/12C- ratio image. The images in (c,f) result from the pixel-by-pixel division of the 12C15N- image by the 12C14N- image and of the 13C- image by the 12C- image, respectively. Scale bar = 10 μm. (g-l) High-resolution quantitative MIMS images of the stereocilia labeled Sb1 in (a). The isotopes and ratios shown in each image are indicated and are the same as the equivalent images in (a-f). All images are 3 × 3 μm (256 × 256 pixels) and an acquisition time of 40 msec/pixel. Scale bar = 0.5 μm. (m) HSI image of the 12C15N/12C14N ratio derived from (h) and (g). The colors correspond to the excess 15N derived from the measured 12C15N-/12C14N- isotope ratios, expressed as a percentage of the 15N excess in the feed, which is a measure of protein renewal; values range from 0% (blue) to 60% and higher (magenta). Small magenta areas (α, β, γ, δ, ε, and ζ) indicate excess 15N. The image is 3 × 3 μm (256 × 256 pixels) and dwell time was 40 msec/pixel. (n) Bar graph of the mean percentage at the stereocilia level of the 15N excess in the feed, which is a measure of protein renewal, after 9 days or 22 days of 15N-L-leucine diet. L, inter-stereocilia structures; S, core stereocilia at 100–200 nm from L. (o) Bar graph of the mean value of the 13C/12C ratio measured after 9 days at the same locations as in (n). t, value of the natural terrestrial 13C/12C ratio.
Figure 5
Figure 5
Use of MIMS to study nitrogen-fixing bacteria. (a-c) Secondary ion images from the molecular ions (a) 12C14N-, (b) 12C15N-, and (c) the HSI 12C15N-/12C14N- ratio of a sample containing both Teredinibacter turnerae (Tt; rod-like cells) and Enterococcus faecalis (Ef; bunches of rounded cells) cultured in a 15N atmosphere for 120 h. Field: 46 × 46 μm (512 × 512 pixels); acquisition time 3 min. The magenta color of the T. turnerae cells is an indication of their incorporation and fixation of 15N (see Figure 3 for explanation). (d) The effect of scaling of the HSI 12C15N-/12C14N- ratio image (the numerator has been multiplied by 100) from T. turnerae cells exposed to a 15N atmosphere for 32 h. Assigning the hue spectrum to the whole range of ratio values allows easy identification of bacteria most highly enriched in 15N (the turquoise cells in the top left panel). Compressing the hue scale (shown gradually from top left to lower right) causes images of some of the cells to saturate at the magenta level and allows us to easily recognize a succession of cells also enriched in 15N, although at a lower level. The isotope values start with 0–7 (top left; a value of 7 is 19-fold higher than the natural ratio) and go to 0–0.5 (bottom right; a value of 0.5 is 1.43 times the natural ratio). The field of view is 13 × 13 μm (256 × 256 pixels); acquisition time 20 min. (e,f) HSI image of the 12C15N-/12C14N- ratio (the numerator has been multiplied by 100) of a T. turnerae cell exposed to a 15N atmosphere for 96 h. Field: (e) 8 × 8 μm; (f) 6 × 6 μm. Acquisition time: (e) 10 min; (f) 40 min. (g,h) HSI image of (g) the 12C15N-/12C14N- ratio (the numerator has been multiplied by 100) and (h) the 13C-/12C- ratio of T. turnerae in shipworm gill bacteriocytes incubated in the presence of a 15N atmosphere for 4 h. Field: 10 μm × 10 μm (256 × 256 pixels); acquisition time 60 min. (i,j) HSI image (i) of the 12C15N-/12C14N- ratio (the numerator has been multiplied by 100) and (j) at 12C15N- of T. turnerae exposed for 96 h in a 15N atmosphere. Arrows indicate the flagella of the bacteria. Field: 60 × 60 μm (256 × 256 pixels); acquisition time 20 min. (k) Line scan across the flagellum observed in (i,j) showing 12C15N- secondary-ion counts as a function of pixel address across the flagellum. One pixel is equivalent to 234 nm. Inset: arrow points to the flagellum; the red box indicates the area of the bacterium that was used to evaluate the mean 12C15N- counts.
Figure 4
Figure 4
Fatty-acid transport in cultured adipocytes. (a-i) MIMS mass images of cells dried with argon after unwashed 3T3F442A adipocytes were incubated with 13C- oleate. Images show (a) 12C-, (b) 13C-, (d) 12C14N-, and (e) 12C15N-, and their respective ratio images of (c) 13C-/12C- and (f) 12C15N-/12C14N-. (g) HSI image of the 13C-/12C- ratio (the numerator has been multiplied by 100); (h) an RDIC image of the same cells before analysis with MIMS. RDIC images (500×) were obtained using a Nikon Eclipse E800 upright microscope. (i) The 13C14N-/12C14N- distribution also reveals the excess 13C in the lipid droplets. O, outside the cells; I, inside but not in visible lipid droplets; LD, inside the lipid droplets. The MIMS images are 60 × 60 μm (256 × 256 pixels) and were acquired in 40 min. (j) HSI of the 13C/12C ratio after 'shaving' (see text) the adipocyte shown in (a-i); the adipocyte had been exposed to a high primary-ion beam current approximately 1,000-fold more intense than for the previous analysis to quickly remove material from the sample surface in order to analyze deeper within the cell. Field: 60 × 60 μm (256 × 256 pixels); acquisition time 10 msec/pixel. (k) Bar graph of the mean and standard deviation values of the 13C-/12C- ratio in 3T3F442A adipocytes. O, outside the cells; I, inside but not in visible lipid droplets; LD, inside the lipid droplets. 13C-/12C- ratio values are shown after subtraction of the natural abundance ratio (1.2%). Adapted with permission from [28].
Figure 6
Figure 6
Cell replication and protein renewal in post-ischemic mouse kidney analyzed with double labeling with BrdU, analyzed as 81Br- and 15N-leucine. (a,b) Wide-view parallel quantitative mass image of (a) 12C14N- and (b) 81Br-. The 81Br- label indicates a cell with replicated DNA. Field: 100 μm × 100 μm (256 × 256 pixels); acquisition time 2 min. (c-e) Higher-resolution parallel images of the boxed regions in (a,b) for (c) 12C14N-; (d) 31P-; (e) 81Br-. The 31P- image enables identification of other cells with unreplicated DNA. Field: 23 × 23 μm (256 × 256 pixels); acquisition time 60 min. (f,g) Parallel quantitative mass images for (f) 12C14N- and (g) 12C15N-, from which protein renewal is calculated. Field: 23 × 23 μm (256 × 256 pixels); acquisition time 10 min. (h) Quantitation of protein renewal in replicating and non-replicating cells. Cy, cytoplasm; NQ, nucleus of non-replicating cells; NR, nucleus of replicating cells.
Figure 7
Figure 7
Qualitative co-localization of DNA and RNA through simultaneous imaging of RNA and DNA. Rat embryo fibroblasts were pulsed with 15N-uridine and BrdU as markers of newly synthesized RNA and DNA, respectively. (a,b) Parallel mass images at (a) 12C15N- and (b) 81Br-. (c) Overlay of 12C15N- and 81Br- images. 12C15N- is depicted as red (R) and 81Br- as green (G); the overlap between them shows up as yellow. (d) Overlay of 12C14N- and 12C15N- images. 12C14N- is depicted as red (R) and 12C15N- as green (G); the overlap between them shows up as yellow. Conditions of MIMS analysis: beam current 2pA; beam diameter 100 nm; field 20 × 20 μm.
Figure 8
Figure 8
Distinguishing between an artifact and the subnucleolar heterogeneity of 15N-uridine incorporation. (a,b) Parallel quantitative mass images of (a) 12C14N- and (b) 12C15N- images of a fibroblast cultured in the presence of 15N-uridine. Ncl, nucleoli; NM, nuclear membrane. Field: 40 × 40 μm (image has been cropped); acquisition time 20 min. (c-e) High-resolution parallel mass images at 12C-, 12C14N- and 12C15N- of the large nucleolus seen in (a,b). Field: 8 × 8 μm; acquisition time 30 min. (c) 12C- image, arising from both tissue and embedding medium; the dark spot (red arrow) was caused by accidental exposure to a stationary high-intensity primary Cs+ ion beam. (d) 12C14N- image. (e) 12C15N- image, showing subnucleolar areas of low local 15N incorporation (white arrows). (f) Ratio of the (d) 12C14N- and (e) 12C15N- images; here, the 'dark spot' (red circle) is barely visible because the value of the 12C15N-/12C15N- ratio is close to that of the surrounding area. (g) HSI image of the 12C15N-/12C14N- ratio (the numerator has been multiplied by 10,000). The 'dark spot' isotope ratio is close to that of the surrounding area. Subnucleolar regions of low incorporation of 15N-uridine stand out in both the (f) ratio and the (g) HSI images. (h) Calibration with 15N-uridine. The graph shows the intranucleolar accumulation of 15N-uridine (measured as 12C15N-/12C14N- (experimental – control)/control) as a function of the concentration of 15N-uridine in the culture medium.
Figure 9
Figure 9
Analysis of gross differences in composition within an unlabeled cell. Endothelial cells were cultured on silicon supports, fixed on the support, dried, and analyzed with MIMS. Quantitative mass images of the surface of a whole endothelial cell were recorded in parallel at masses 12C-, 12C14N- and 31P-. An overlay of these images is shown, with 12C14N in red, 12C in green, and 31P in blue. Scale bar = 10 μm.
Figure 10
Figure 10
A detailed analysis of the edge of a lamellipodium of an unlabeled endothelial cell. This example illustrates analysis by counts per pixel and HSI. (a-c) Three MIMS images acquired in parallel at (a) 12C14N-, (b) 12C-, and (c) 16O-. Field: 60 × 60 μm (256 × 256 pixels); acquisition time 2 min. (d) HSI image of the ratio 12C14N-/12C- (the numerator has been multiplied by 10). Magenta dots (arrowed) indicating areas of high relative 15N incorporation appear at the edge of the lamellipodium. Field: 60 × 60 μm (256 × 256 pixels). (e) HSI images of the ratios 12C14N-/12C- (left) and 16O/12C14N- (right; the numerator has been multiplied by 10). The regularly spaced dots (arrowed) can be seen at the edge of the lamellipodium. (f) At each pixel, arranged from top to bottom, are the values of the 12C14N- counts, the 12C- counts and the 12C14N-/12C- ratio (multiplied by 10) for the pixels shown in the inset in (e). (g) The corresponding values at each pixel, arranged from top to bottom, for the 12C14N-/12C- ratio values (multiplied by 10) and the 16O-/12C14N- ratio (multiplied by 10). (h,i) Bar graph of the mean count values of 12C-, 12C14N- and 16O- on (h) the dot at the periphery of the lamellipodia and (i) the edge of the lamellipodia.
Figure 11
Figure 11
Rat embryo fibroblasts labeled with 14C-thymidine. Fibroblasts were cultured on silicon chips, deprived of serum for 24 h and pulsed with serum and 19 nmol 14C-thymidine/ml (1 mCi/ml). (a,b,c) Simultaneous quantitative mass images of a fibroblast at (a) 12C15N- (grayscale); (b) 14C- (pseudo-color); (c) overlay of the 14C- and 12C15N- images. Field: 50 × 26 μm; acquisition time 14 h. (d,e) Simultaneous quantitative mass images of a control rat embryo fibroblast at (a) 12C15N-; (b) 14C-. Field: 50 × 41 μm; acquisition time 2 h.
Figure 12
Figure 12
Tracking donor cells in a popliteal lymph node of a BALB/c mouse that has been injected in the footpad with 2 × 10⁷ spleen cells from a C57Bl/6 mouse fed for 2 weeks on a 15N diet. (a,b) Parallel quantitative mass imaging at 12C14N- and 12C15N-. (a) A mosaic of 12C14N- images, showing the topology of a lymph-node section. (b) A mosaic of the 12C15N-/12C14N- ratio images, showing 15N-labeled donor cells. Tile field: 100 μm × 100 μm (256 × 256 pixels); acquisition time 2 min per tile (16-tile mosaic). (c-e) Higher-resolution parallel mass imaging at 12C-,13C-, 12C14N- and 12C15N- of the field indicated by the arrow in (a,b). (c) 12C14N- image, (d) 12C15N-/12C14N- ratio image and (e) 13C-/12C- ratio image of the same field. Field: 30 × 30 μm (256 × 256 pixels); acquisition time 40 min.
Figure 13
Figure 13
Diagram of the prototype NanoSims50 used in MIMS. The main components of the instrument include: the primary column (PC) with a cesium primary-ion source (IS) used to sputter the surface of the sample and to enhance the yield of negative secondary ions and a series of lenses (L0, L1, L2 and L3) to shape the primary beam; the objective column (OC), where the same ion optic is used in a coaxial manner both to focus the primary beam on the sample (S) and to collect the secondary ions (the primary-ion beam is focused on the sample with the objective lens (EOP) and aperture limited with the diaphragm (D1), the secondary ions are collected with the secondary-ion focusing lens (EOS)); the secondary column (SC) where the secondary-ion beam is shaped to match the acceptance of the spectrometer (the secondary column contains an entrance slit (ES), a corrector (CY) and deflectors (P2 and P3) to center the secondary-ion beam in the entrance slit); an aperture slit (AS) to reduce the angular aberration of the secondary-ion beam; and the mass spectrometer, made up of the association of an electrostatic prism (EP) and a magnetic prism (MP), which enables the focusing of the secondary ions as narrow lines along the focal plane (FP) of the magnet. Chromatic aberrations are minimized with the quadrupole (Q) and the slit lens (LF4). Energy aberration is reduced with the energy slit (WS). The transmission at high mass resolution is improved by correcting the main second-order aperture aberrations with the hexapole (HX) placed in front of the electrostatic prism, tilting the entry and exit faces of the magnetic prism, and focusing in the vertical section using additional lenses placed between the electrostatic and magnetic prisms. The deflectors (C4) help to center the masses in the detectors. In the multi-collection chamber (MC), four detectors can be moved along the focal plane. Each detector is made up of deflection plates (DP) followed by a selection slit (SS) and a miniature electron multiplier (EM). The deflection plates, which permit scanning of a small portion of the spectrum, greatly improve the final tuning of mass lines. This instrument provides both parallel detection and high mass resolution with little sacrifice in secondary-ion transmission from sample to detector. As a particularly striking example, in Figure 15, the 12C- secondary ions were detected at 90% relative transmission with a mass resolution of 1 part in 11,825.
Figure 14
Figure 14
Parallel quantitative mass imaging with MIMS, using a cochlear field as an example. A schematic representation of the MIMS instrument is shown at the top, with the secondary ions beings selected in parallel by four detectors (T1–T4) which are moved along the focal plane to the appropriate positions for a given mass. The 12C-, 13C-, 12C14N- and 12C15N- quantitative mass images recorded by the four detectors are shown below.
Figure 15
Figure 15
High-resolution mass spectra illustrate the resolving power of our prototype NanoSims instrument. The detectors are positioned along the focal plane at the focal points for the atomic masses (a) 12, (b) 13, (c) 26, and (d) 27 as shown in Figure 14. Varying the electrical potential of the deflector plates selects between different isobaric ions. Note that with the log scale and the counting software, when zero counts are recorded, the data point is recorded as 1/T, where T is the counting time in seconds for each data point. In (a-c) the counting time was 0.5 sec, and the background count rate appears as 2 counts/sec even though it is zero counts; in (d), the counting time was 10 sec and a background count rate of zero is not visible. See Additional data file 6 for more details on the shape of the peaks.

References

    1. Schoenheimer R. The Dynamic State of Body Constituents The Edward K Dunham Lectures for the Promotion of the Medical Sciences. Cambridge, MA: Harvard University Press; 1942.
    1. Castaing R, Slodzian G. Microanalyse par emission ionique secondaire. J Microsc. 1962;1:31–38.
    1. Benninghoven A, Rudenauer FG, Werner HW. In: Secondary Ion Mass Spectrometry: Basic Concepts, Instrumental Aspects, Applications and Trends. Elving PJ, Winefordner JD, Kolthoff IM, editor. Vol. 86. Chichester, UK: John Wiley & Sons; 1987.
    1. Castner DG. Surface science: view from the edge. Nature. 2003;422:129–130. doi: 10.1038/422129a. - DOI - PubMed
    1. Meibom A, Frei R. Evidence for an ancient osmium isotopic reservoir in Earth. Science. 2002;296:516–518. doi: 10.1126/science.1069119. - DOI - PubMed

Publication types