. 2006 Oct;18(10):2710-32.
doi: 10.1105/tpc.105.039404. Epub 2006 Sep 29.

Tocopherols play a crucial role in low-temperature adaptation and Phloem loading in Arabidopsis

Affiliations

Tocopherols play a crucial role in low-temperature adaptation and Phloem loading in Arabidopsis

Hiroshi Maeda et al. Plant Cell. 2006 Oct.

Abstract

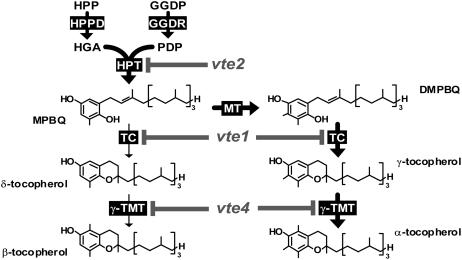
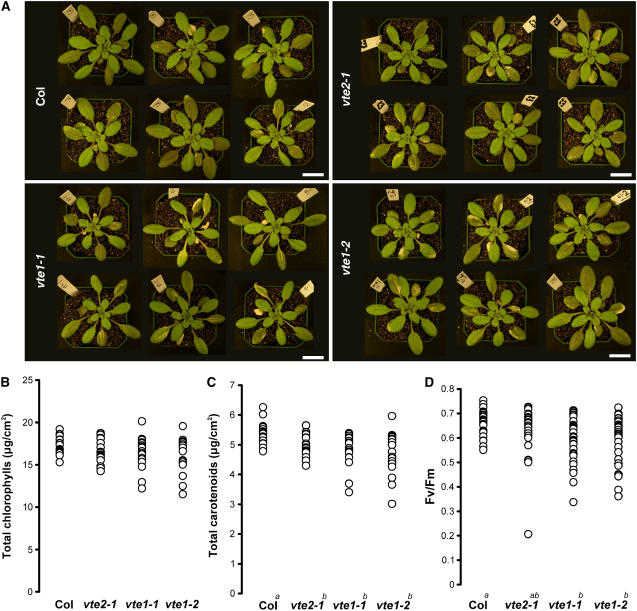
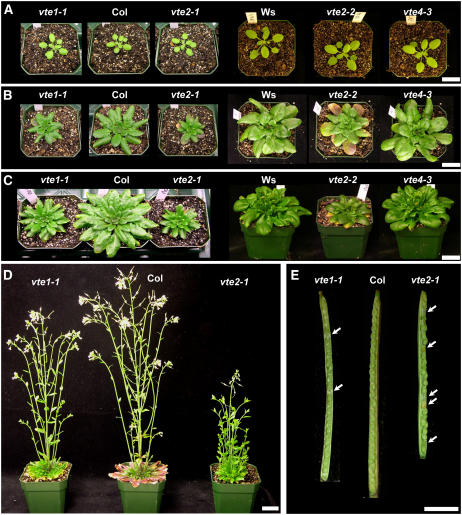
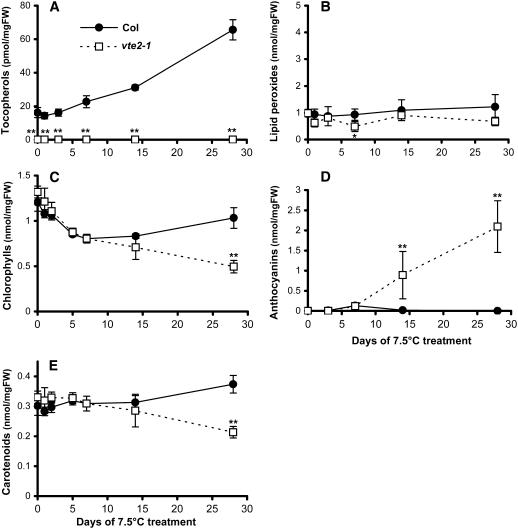
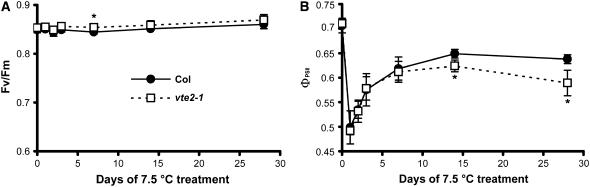
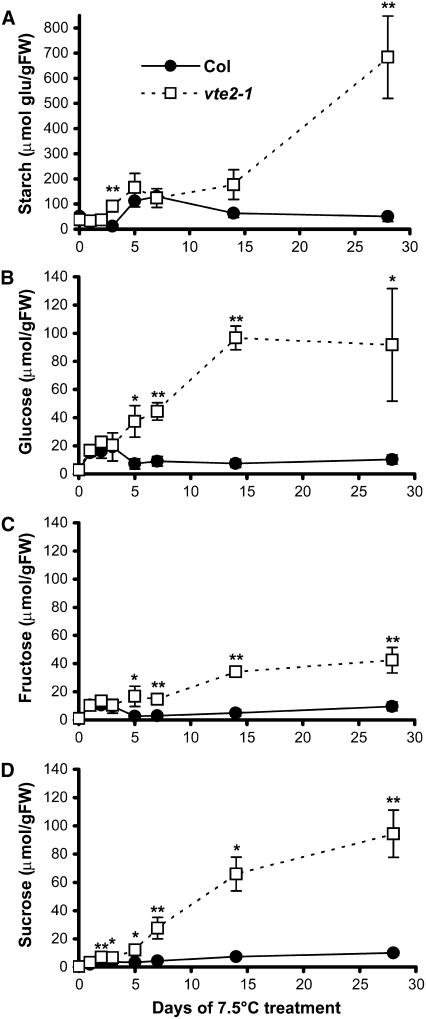
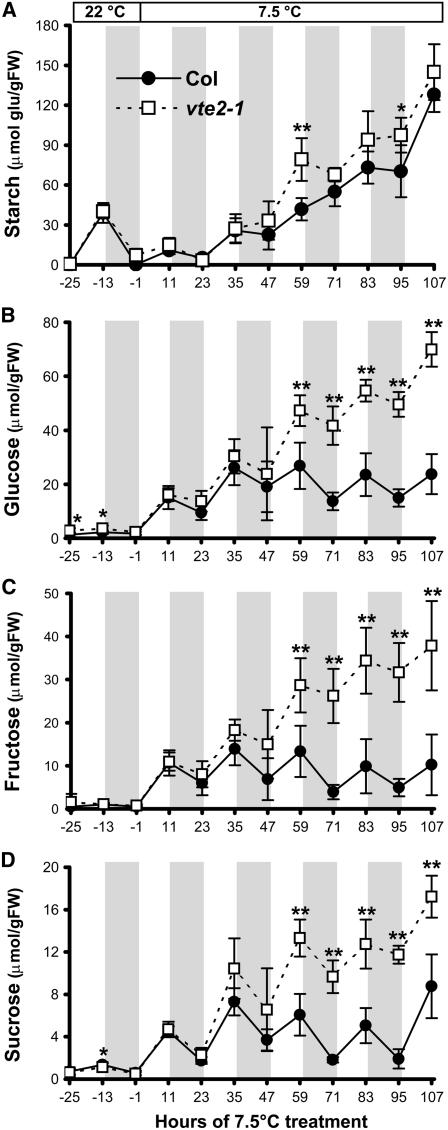
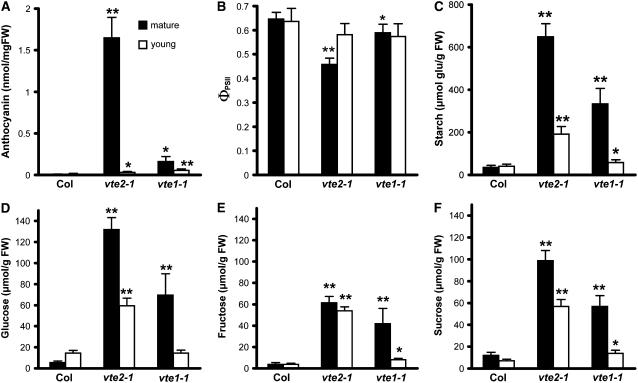
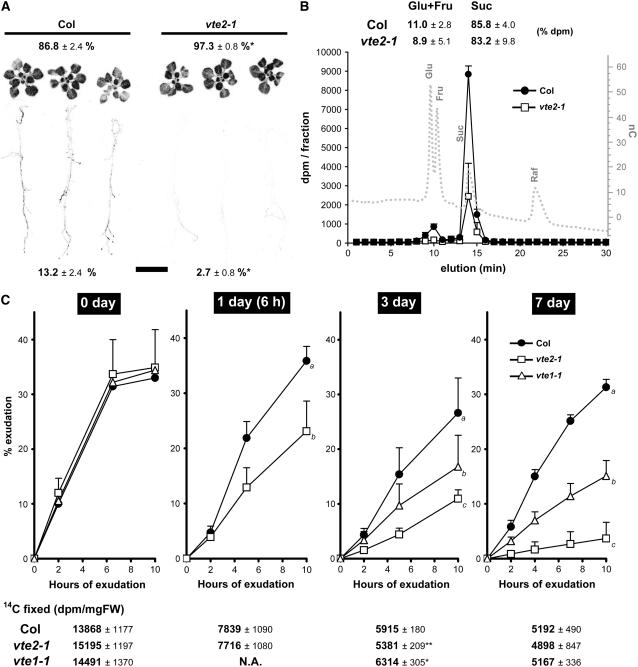
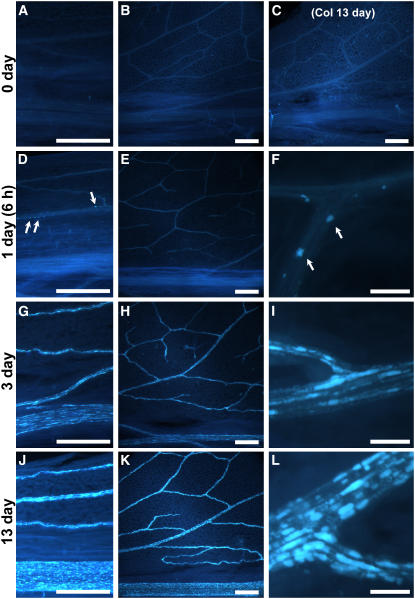
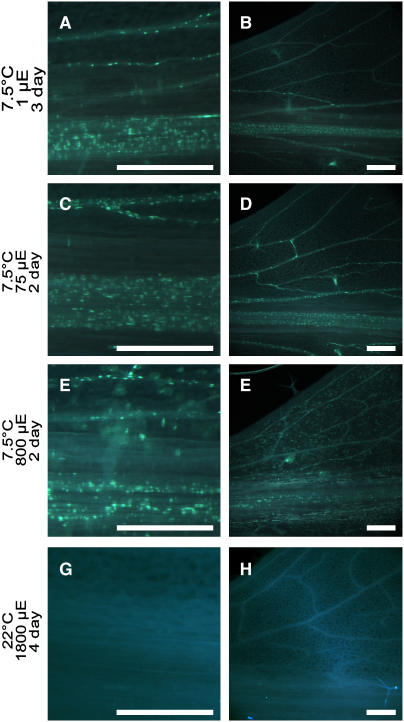
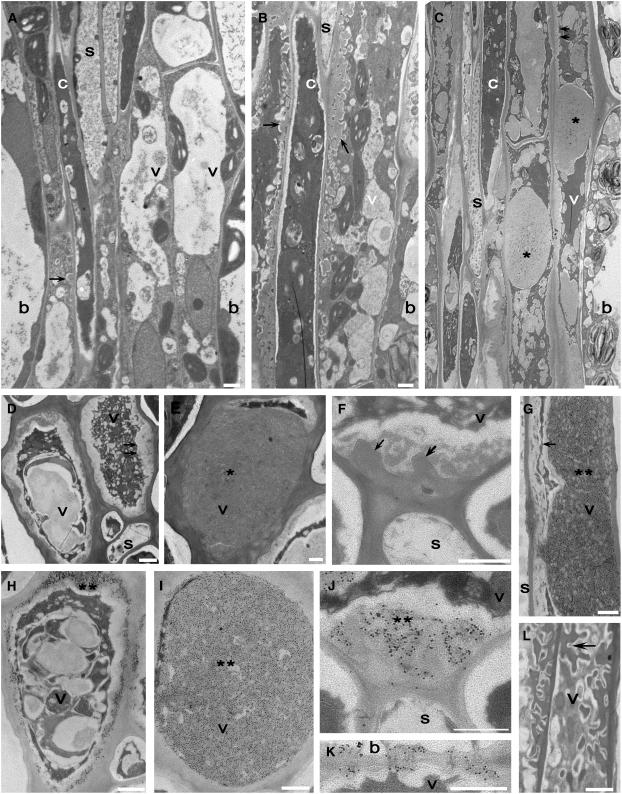
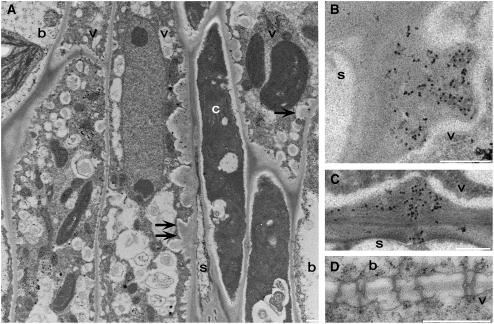
To test whether tocopherols (vitamin E) are essential in the protection against oxidative stress in plants, a series of Arabidopsis thaliana vitamin E (vte) biosynthetic mutants that accumulate different types and levels of tocopherols and pathway intermediates were analyzed under abiotic stress. Surprisingly subtle differences were observed between the tocopherol-deficient vte2 mutant and the wild type during high-light, salinity, and drought stresses. However, vte2, and to a lesser extent vte1, exhibited dramatic phenotypes under low temperature (i.e., increased anthocyanin levels and reduced growth and seed production). That these changes were independent of light level and occurred in the absence of photoinhibition or lipid peroxidation suggests that the mechanisms involved are independent of tocopherol functions in photoprotection. Compared with the wild type, vte1 and vte2 had reduced rates of photoassimilate export as early as 6 h into low-temperature treatment, increased soluble sugar levels by 60 h, and increased starch and reduced photosynthetic electron transport rate by 14 d. The rapid reduction in photoassimilate export in vte2 coincides with callose deposition exclusively in phloem parenchyma transfer cell walls adjacent to the companion cell/sieve element complex. Together, these results indicate that tocopherols have a more limited role in photoprotection than previously assumed but play crucial roles in low-temperature adaptation and phloem loading.


Figures

Figure 1.
Figure 1.
Tocopherol Biosynthetic Pathway and vte Mutations in Arabidopsis. Enzymes are indicated by black boxes, and mutations are indicated by gray letters and lines. Thick arrows show the primary biosynthetic route in wild-type leaves. DMPBQ, 2,3-dimethyl-6-phytyl-1,4-benzoquinol; GGDP, geranylgeranyl diphosphate; GGDR, GGDP reductase; HGA, homogentisic acid; HPP, hydroxyphenylpyruvate; HPPD, HPP dioxygenase; HPT, HGA phytyltransferase; MPBQ, 2-methyl-6-phytyl-1,4-benzoquinol; MT, MPBQ methyltransferase; PDP, phytyl diphosphate; TC, tocopherol cyclase; γ-TMT, γ-tocopherol methyltransferase; vte1, vte2, and vte4, mutants of TC, HPT, and γ-TMT, respectively.
Figure 2.
Figure 2.
Phenotypic and Photosynthetic Responses of Col and the vte2 and vte1 Mutants to HL Stress. Plants were grown under permissive conditions for 4 weeks and then transferred to HL stress in the middle of the day. When significance was observed between genotypes (analysis of variance [ANOVA], P < 0.05), pair-wise comparison of least-square means was evaluated; nonsignificant groups are indicated by a, b, or c, with a being the highest group. (A) Six representative plants after 3 d of HL1800. Bars = 2 cm. (B) and (C) Individual values of total chlorophyll (B) and carotenoid (C) contents from 19 leaves after 4 d of HL1800. (D) Individual values of Fv/Fm from 30 leaves after 24 h of HL1800.
Figure 3.
Figure 3.
Visible Phenotypes of vte Mutants during Extended Low-Temperature Treatment. Plants were grown under permissive conditions for 3 weeks and then subjected to 7.5°C treatment for the indicated time periods. (A) to (D) Representative plants of 3-week-old wild type (Col and Ws), vte1-1 and vte2-1 (Col background), and vte2-2 and vte4-3 (Ws background) after 0 d (A), 1 month (B), 2 months (C), and 4 months (D) of 7.5°C treatment. Bars = 2 cm. (E) Representative siliques from Col, vte1-1, and vte2-1 plants after 5 months of low-temperature treatment. Arrows denote aborted seeds in vte1-1 and vte2-1 siliques. Bar = 0.2 cm.
Figure 4.
Figure 4.
Tocopherol, Lipid Peroxide, Anthocyanin, and Photosynthetic Pigment Contents of Col and the vte2 Mutant during 4 Weeks of Low-Temperature Treatment. Col (closed circles) and vte2-1 (open squares) were grown under permissive conditions for 4 weeks and then transferred to 7.5°C conditions at the beginning of the light cycle for the indicated times. Data are means ± sd (n = 3 or 4). * P < 0.05, ** P < 0.01 by Student's t test of vte2-1 relative to Col at each time point. FW, fresh weight. (A) Total tocopherols. (B) Lipid peroxides. (C) Total chlorophylls. (D) Anthocyanins. (E) Total carotenoids.
Figure 5.
Figure 5.
Photosynthetic Status of Col and the vte2 Mutant during 4 Weeks of Low-Temperature Treatment. Col (closed circles) and vte2-1 (open squares) were grown under permissive conditions for 4 weeks and then transferred to 7.5°C conditions at the beginning of the light cycle for the indicated times. Analysis was conducted in the middle of the light cycle. Data are means ± sd (n = 4). * P < 0.05 by Student's t test of vte2-1 relative to Col at each time point. (A) Maximum photosynthetic efficiency (Fv/Fm). (B) Quantum yield of PSII (ΦPSII).
Figure 6.
Figure 6.
Changes in Starch and Soluble Sugar Levels in Col and the vte2 Mutant during 4 Weeks of Low-Temperature Treatment. Col (closed circles) and vte2-1 (open squares) were grown under permissive conditions for 4 weeks and then transferred to 7.5°C conditions at the beginning of the light cycle for the indicated times. Samples were harvested at the end of the light cycle. Day 0 of cold treatment indicates the end of the light cycle and the day before initiating 7.5°C treatment. Starch is expressed as micromoles of glucose equivalents per gram fresh weight (FW). Data are means ± sd (n = 3 or 4). * P < 0.05, ** P < 0.01 by Student's t test of vte2-1 relative to Col at each time point. (A) Starch. (B) Glucose. (C) Fructose. (D) Sucrose.
Figure 7.
Figure 7.
Diurnal Changes in Starch and Soluble Sugar Levels in Col and the vte2 Mutant during the First 4 d of Low-Temperature Treatment. Col (closed circles) and vte2-1 (open squares) were grown under permissive conditions for 4 weeks and then transferred to 7.5°C conditions at the beginning of the light cycle for the indicated times. Samples were harvested at the end of the dark and light cycles. Gray areas indicate the 12-h dark cycles. Hour 0 of cold treatment indicates the beginning of the first light cycle of the low-temperature treatment. Starch is expressed as micromoles of glucose equivalents per gram fresh weight (FW). Data are means ± sd (n = 5). * P < 0.05, ** P < 0.01 by Student's t test of vte2-1 relative to Col at each time point. (A) Starch. (B) Glucose. (C) Fructose. (D) Sucrose.
Figure 8.
Figure 8.
Biochemical Phenotypes in Mature and Young Leaves of Col and the vte2 and vte1 Mutants after 4 Weeks of Low-Temperature Treatment. Col, vte2-1, and vte1-1 were grown under permissive conditions for 4 weeks and then transferred to 7.5°C conditions at the beginning of the light cycle for an additional 4 weeks. Mature leaves (7th to 9th oldest; black bars) and young leaves (13th to 16th oldest; white bars) were harvested at the end of the light cycle for analyses in (A) and (C) to (F). The photosynthetic parameter in (B) was measured in the middle of the light cycle. Data are means ± sd (n = 4 or 5). * P < 0.05, ** P < 0.01 by Student's t test of mutant leaves relative to corresponding Col young or mature leaves. FW, fresh weight. (A) Anthocyanin content. (B) Quantum yield of PSII (ΦPSII). (C) Starch content expressed as micromoles of glucose equivalents per gram fresh weight. (D) to (F) Glucose (D), fructose (E), and sucrose (F) contents.
Figure 9.
Figure 9.
Translocation and Export of 14C-Labeled Photoassimilates in Low-Temperature-Treated Col and the vte2 and vte1 Mutants. (A) 14C-labeled photoassimilate translocation of Col and vte2-1 treated for 7 d at 7.5°C. Percentage label detected in leaves (top) and roots (bottom) is indicated as means ± sd (n = 3). * P < 0.05 by Student's t test relative to Col. (B) HPLC analysis of phloem exudates collected from mature leaves of Col and vte2-1 treated for 10 d at 7.5°C. The HPLC trace of sugar standards is shown as a dotted gray line. The percentage of label detected in the glucose/fructose and sucrose fractions is indicated as means ± sd (n = 3). Fru, fructose; Glu, glucose; Raf, raffinose; Suc, sucrose. (C) Phloem exudation of 14C-labeled photoassimilates from Col and vte2-1 and vte1-1 mature leaves during 7 d of 7.5°C treatment. Total 14C fixed per milligram fresh weight (FW) of each sample at the indicated time after transfer to 7.5°C is shown below each graph. Data are means ± sd (n = 6 to 8). Two-factor ANOVA using end points (values at 10 h of exudation) indicates that interactions are significant (P < 0.05, with days of 7.5°C treatment and genotype as factors). The pair-wise comparisons of least-square means between genotypes at 1, 3, and 7 d of 7.5°C treatment are indicated as a, b, or c; day-0 values were not significant. N.A., data not available.
Figure 10.
Figure 10.
Aniline Blue–Positive Fluorescence in Leaves of Col and the vte2 Mutant during Low-Temperature Treatment. Col (C) and vte2-1 (all panels except [C]) were grown under permissive conditions for 4 weeks and then transferred to 7.5°C at the beginning of the light cycle. Leaves were harvested in the middle of the day before 7.5°C treatment (0 d; [A] and [B]) and after 1 d (6 h; [D] to [F]), 3 d ([G] to [I]), and 13 d ([C] and [J] to [L]) of 7.5°C treatment, and aniline blue–positive fluorescence were observed at leaf petioles ([A], [D], [G], and [J]), the lower half of leaves ([B], [C], [E], [H], and [K]), and vein junctions ([F], [I], and [L]). Arrows in (D) and (F) denote highly fluorescent spots that initially appear in side veins of vte2-1 petioles after 6 h of 7.5°C treatment. Bars = 50 μm for (F), (I), and (L) and 500 μm for all other panels.
Figure 11.
Figure 11.
Aniline Blue–Positive Fluorescence in Leaves of the vte2 Mutant at Various Light Intensities under Permissive and Low-Temperature Conditions. vte2-1 was grown under permissive conditions for 4 weeks and then transferred at the beginning of the light cycle to 12 h of light and 12 h of darkness at the indicated light levels at 7.5°C ([A] to [F]) and in the middle of the day to HL1800 at 22°C ([G] and [H]). Leaves were harvested in the middle of the day. Aniline blue–positive fluorescence was observed at leaf petioles ([A], [C], [E], and [G]) and the lower half of leaves ([B], [D], [F], and [H]). Bars = 500 μm. (A) and (B) 7.5°C at 1 μmol·m−2·s−1 for 3 d (54 h). (C) and (D) 7.5°C at 75 μmol·m−2·s−1 for 2 d (30 h). (E) and (F) 7.5°C at 800 μmol·m−2·s−1 for 2 d (30 h). (G) and (H) 22°C at 1800 μmol·m−2·s−1 for 4 d (72 h).
Figure 12.
Figure 12.
Cellular Structure and Immunodetection of Callose in Col and vte2-1 before and after 14 d of Low-Temperature Treatment. (A) vte2-1 before 7.5°C treatment. (B) to (L) vte2-1 ([C] to [K]) and Col ([B] and [L]) after 14 d of 7.5°C treatment. (G) to (L) are immunolabeled with anti-β-1,3-glucan antibody. (D) to (F) are controls with only secondary antibody. Single arrows denote phloem parenchyma transfer cell wall ingrowths. Double arrows denote abnormal thickening of phloem parenchyma transfer cell wall ingrowths. Single asterisks mark massive wall ingrowths of phloem parenchyma transfer cells. Double asterisks mark wall ingrowths immunolabeled with anti-β-1,3-glucan. Paradermal ([C] and [G]) and transverse ([E] and [I]) sections show the entire phloem parenchyma transfer cell occluded with callose. Paradermal ([C] and [G]) and transverse ([D] and [H]) sections show the peripheral callose sheath of phloem parenchyma transfer cells. Note the callose at the boundary between the phloem parenchyma transfer cell and the sieve element ([F] and [J]). Plasmodesmata between the bundle sheath (top cell) and the phloem parenchyma transfer cell immunolabeled with anti-β-1,3-glucan are shown in (K). b, bundle sheath; c, companion cell; s, sieve element; v, vascular parenchyma transfer cell. Bars = 1 μm (all panels except [C]) and 5 μm (C).
Figure 13.
Figure 13.
Cellular Structure and Immunodetection of Callose in vte2-1 after 3 d of Low-Temperature Treatment. (A) Single arrows denote phloem parenchyma transfer cell wall ingrowths adjacent to the bundle sheath. Double arrows denote abnormal thickening of phloem parenchyma transfer cell wall ingrowths adjacent to the companion cell. Note that transfer cell wall ingrowths are present around the entire phloem parenchyma transfer cell. (B) to (D) are immunolabeled with anti-β-1,3-glucan antibody. (B) Transverse section of wall ingrowths immunolabeled with anti-β-1,3-glucan at the phloem parenchyma transfer cell and sieve element boundary. (C) Plasmodesmata between the phloem parenchyma transfer cell (top cell) and the sieve element are immunopositive for anti-β-1,3-glucan. (D) Plasmodesmata between the bundle sheath (top cell) and the phloem parenchyma cell are continuous, lack callose-like wall depositions, and are immunonegative for anti-β-1,3-glucan. b, bundle sheath; c, companion cell; s, sieve element; v, vascular parenchyma transfer cell. Bars = 0.5 μm.

References

    1. Bergmuller, E., Porfirova, S., and Dormann, P. (2003). Characterization of an Arabidopsis mutant deficient in gamma-tocopherol methyltransferase. Plant Mol. Biol. 52 1181–1190. - PubMed
    1. Bjorkman, O., and Demmig, B. (1987). Photon yield of O2 evolution and chlorophyll fluorescence characteristics at 77 K among vascular plants of diverse origins. Planta 170 489–504. - PubMed
    1. Botha, C.E.J., Cross, R.H.M., van Bel, A.J.E., and Peter, C.I. (2000). Phloem loading in the sucrose-export-defective (SXD-1) mutant maize is limited by callose deposition at plasmodesmata in bundle sheath-vascular parenchyma interface. Protoplasma 214 65–72.
    1. Bradford, A., Atkinson, J., Fuller, N., and Rand, R.P. (2003). The effect of vitamin E on the structure of membrane lipid assemblies. J. Lipid Res. 44 1940–1945. - PubMed
    1. Bramley, P.M., Elmadfa, I., Kafatos, A., Kelly, F.J., Manios, Y., Roxborough, H.E., Schuch, W., Sheehy, P.J.A., and Wagner, K.H. (2000). Vitamin E. J. Sci. Food Agric. 80 913–938.

Publication types