

Establishment of the epithelial-specific transcriptome of normal and malignant human breast cells based on MPSS and array expression data
- PMID: 17014703
- PMCID: PMC1779497
- DOI: 10.1186/bcr1604
Establishment of the epithelial-specific transcriptome of normal and malignant human breast cells based on MPSS and array expression data
Abstract
Introduction: Diverse microarray and sequencing technologies have been widely used to characterise the molecular changes in malignant epithelial cells in breast cancers. Such gene expression studies to identify markers and targets in tumour cells are, however, compromised by the cellular heterogeneity of solid breast tumours and by the lack of appropriate counterparts representing normal breast epithelial cells.
Methods: Malignant neoplastic epithelial cells from primary breast cancers and luminal and myoepithelial cells isolated from normal human breast tissue were isolated by immunomagnetic separation methods. Pools of RNA from highly enriched preparations of these cell types were subjected to expression profiling using massively parallel signature sequencing (MPSS) and four different genome wide microarray platforms. Functional related transcripts of the differential tumour epithelial transcriptome were used for gene set enrichment analysis to identify enrichment of luminal and myoepithelial type genes. Clinical pathological validation of a small number of genes was performed on tissue microarrays.
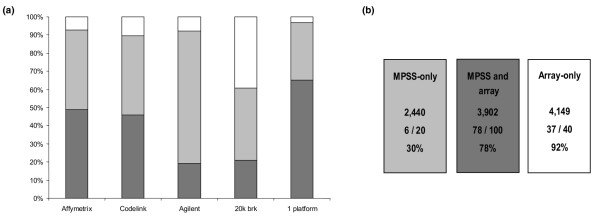
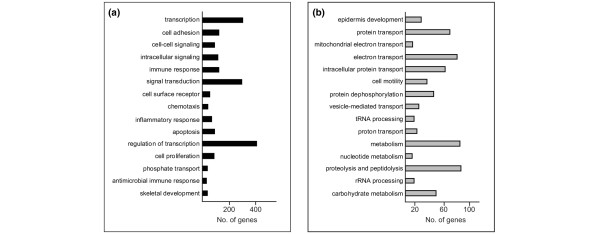
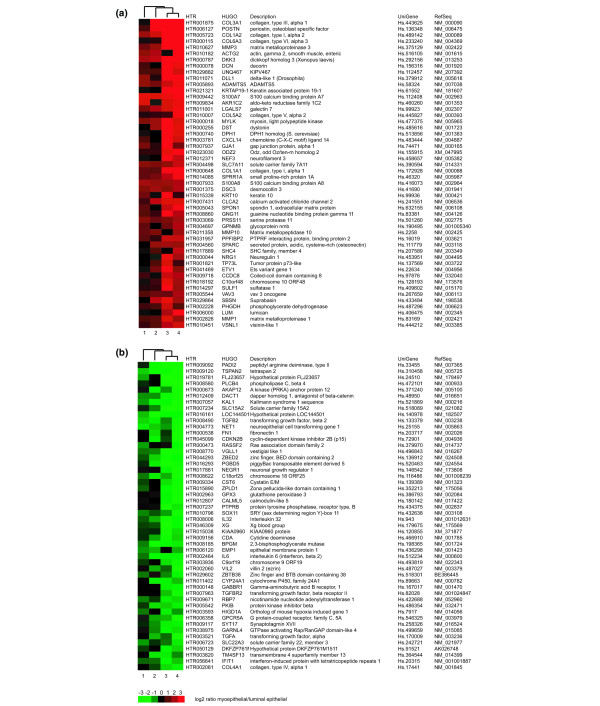
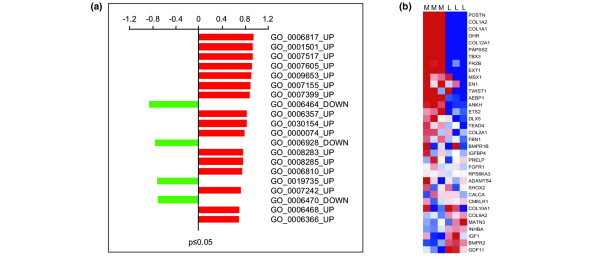
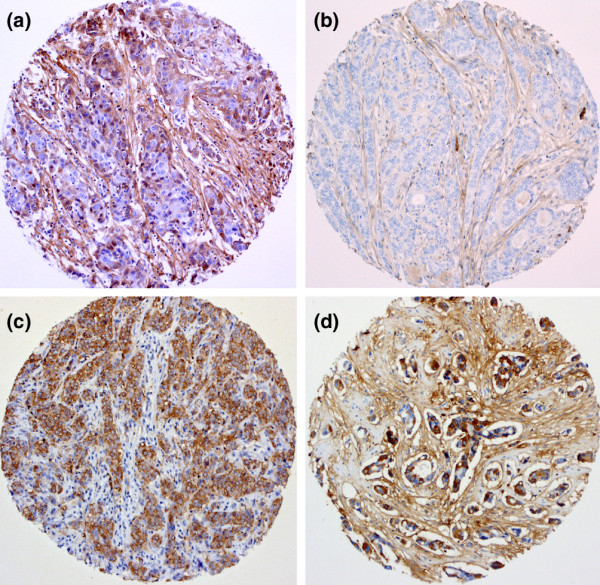
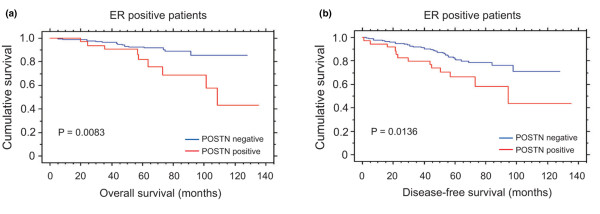
Results: MPSS identified 6,553 differentially expressed genes between the pool of normal luminal cells and that of primary tumours substantially enriched for epithelial cells, of which 98% were represented and 60% were confirmed by microarray profiling. Significant expression level changes between these two samples detected only by microarray technology were shown by 4,149 transcripts, resulting in a combined differential tumour epithelial transcriptome of 8,051 genes. Microarray gene signatures identified a comprehensive list of 907 and 955 transcripts whose expression differed between luminal epithelial cells and myoepithelial cells, respectively. Functional annotation and gene set enrichment analysis highlighted a group of genes related to skeletal development that were associated with the myoepithelial/basal cells and upregulated in the tumour sample. One of the most highly overexpressed genes in this category, that encoding periostin, was analysed immunohistochemically on breast cancer tissue microarrays and its expression in neoplastic cells correlated with poor outcome in a cohort of poor prognosis estrogen receptor-positive tumours.
Conclusion: Using highly enriched cell populations in combination with multiplatform gene expression profiling studies, a comprehensive analysis of molecular changes between the normal and malignant breast tissue was established. This study provides a basis for the identification of novel and potentially important targets for diagnosis, prognosis and therapy in breast cancer.
Figures
Similar articles
-
Expression profiling of purified normal human luminal and myoepithelial breast cells: identification of novel prognostic markers for breast cancer.Cancer Res. 2004 May 1;64(9):3037-45. doi: 10.1158/0008-5472.can-03-2028. Cancer Res. 2004. PMID: 15126339
-
Semaphorin-plexin signalling genes associated with human breast tumourigenesis.Gene. 2011 Dec 10;489(2):63-9. doi: 10.1016/j.gene.2011.08.024. Epub 2011 Sep 2. Gene. 2011. PMID: 21925246
-
Regulator of G-protein signalling 2 mRNA is differentially expressed in mammary epithelial subpopulations and over-expressed in the majority of breast cancers.Breast Cancer Res. 2007;9(6):R85. doi: 10.1186/bcr1834. Breast Cancer Res. 2007. PMID: 18067675 Free PMC article.
-
The phenotypic spectrum of basal-like breast cancers: a critical appraisal.Adv Anat Pathol. 2007 Sep;14(5):358-73. doi: 10.1097/PAP.0b013e31814b26fe. Adv Anat Pathol. 2007. PMID: 17717437 Review.
-
The cell of origin of BRCA1 mutation-associated breast cancer: a cautionary tale of gene expression profiling.J Mammary Gland Biol Neoplasia. 2011 Apr;16(1):51-5. doi: 10.1007/s10911-011-9202-8. Epub 2011 Feb 19. J Mammary Gland Biol Neoplasia. 2011. PMID: 21336547 Review.
Cited by
-
Deep sequencing-based expression analysis shows major advances in robustness, resolution and inter-lab portability over five microarray platforms.Nucleic Acids Res. 2008 Dec;36(21):e141. doi: 10.1093/nar/gkn705. Epub 2008 Oct 15. Nucleic Acids Res. 2008. PMID: 18927111 Free PMC article.
-
Downregulation of USP32 inhibits cell proliferation, migration and invasion in human small cell lung cancer.Cell Prolif. 2017 Aug;50(4):e12343. doi: 10.1111/cpr.12343. Epub 2017 Jun 9. Cell Prolif. 2017. PMID: 28597490 Free PMC article.
-
Comparison of hybridization-based and sequencing-based gene expression technologies on biological replicates.BMC Genomics. 2007 Jun 7;8:153. doi: 10.1186/1471-2164-8-153. BMC Genomics. 2007. PMID: 17555589 Free PMC article.
-
Extracellular sulfatases, elements of the Wnt signaling pathway, positively regulate growth and tumorigenicity of human pancreatic cancer cells.PLoS One. 2007 Apr 25;2(4):e392. doi: 10.1371/journal.pone.0000392. PLoS One. 2007. PMID: 17460759 Free PMC article.
-
PMC42, a breast progenitor cancer cell line, has normal-like mRNA and microRNA transcriptomes.Breast Cancer Res. 2008;10(3):R54. doi: 10.1186/bcr2109. Epub 2008 Jun 27. Breast Cancer Res. 2008. PMID: 18588681 Free PMC article.
References
-
- Abd El-Rehim DM, Ball G, Pinder SE, Rakha E, Paish C, Robertson JF, Macmillan D, Blamey RW, Ellis IO. High-throughput protein expression analysis using tissue microarray technology of a large well-characterised series identifies biologically distinct classes of breast cancer confirming recent cDNA expression analyses. Int J Cancer. 2005;116:340–350. doi: 10.1002/ijc.21004. - DOI - PubMed
-
- Nielsen TO, Hsu FD, Jensen K, Cheang M, Karaca G, Hu Z, Hernandez-Boussard T, Livasy C, Cowan D, Dressler L, et al. Immunohistochemical and clinical characterization of the basal-like subtype of invasive breast carcinoma. Clin Cancer Res. 2004;10:5367–5374. doi: 10.1158/1078-0432.CCR-04-0220. - DOI - PubMed
-
- Sorlie T, Perou CM, Tibshirani R, Aas T, Geisler S, Johnsen H, Hastie T, Eisen MB, van de Rijn M, Jeffrey SS, et al. Gene expression patterns of breast carcinomas distinguish tumor subclasses with clinical implications. Proc Natl Acad Sci USA. 2001;98:10869–10874. doi: 10.1073/pnas.191367098. - DOI - PMC - PubMed
Publication types
MeSH terms
Substances
Grants and funding
LinkOut - more resources
Full Text Sources
Other Literature Sources
Medical
Miscellaneous
