. 2006 Dec 22;273(1605):3075-83.
doi: 10.1098/rspb.2006.3681.

How do pathogen evolution and host heterogeneity interact in disease emergence?

Affiliations

How do pathogen evolution and host heterogeneity interact in disease emergence?

Andrew Yates et al. Proc Biol Sci. .

Abstract

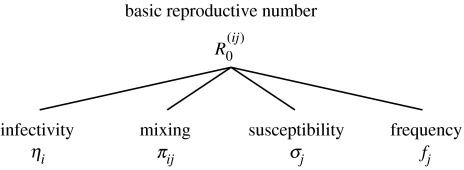
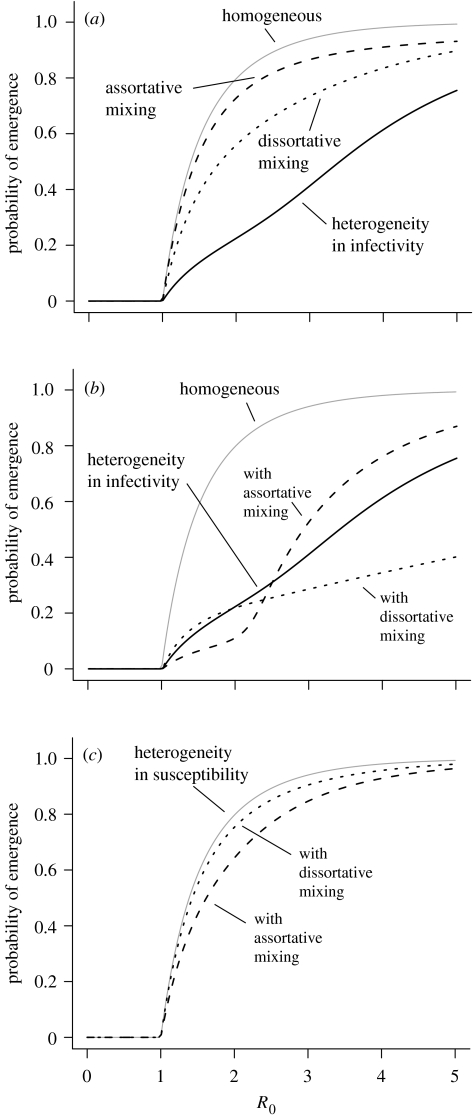
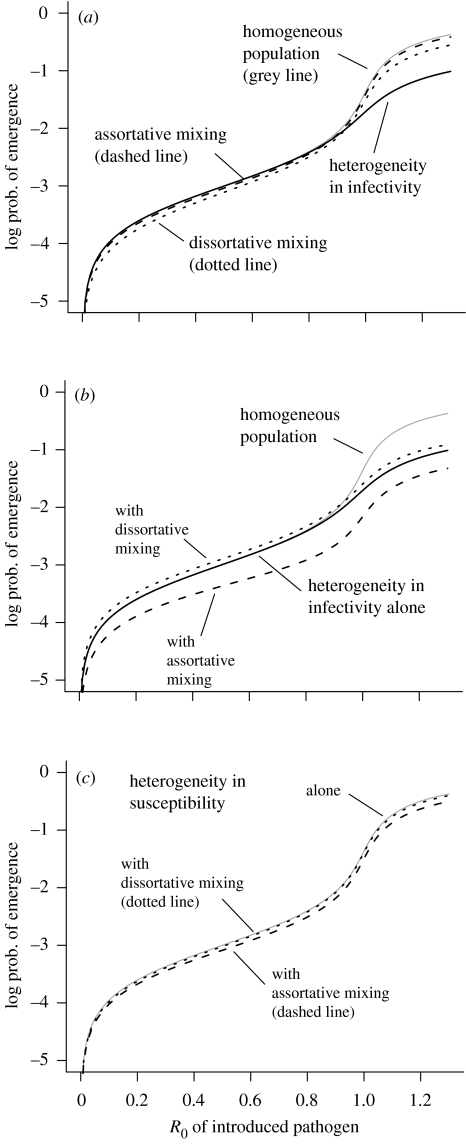
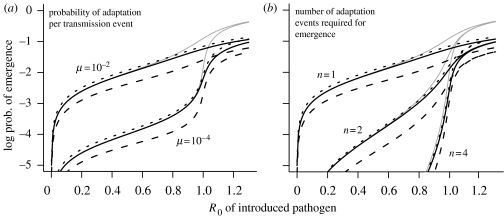
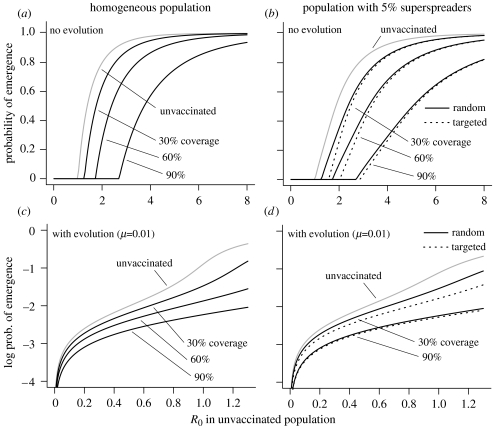
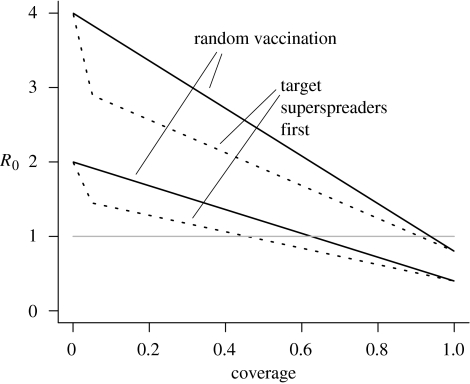
Heterogeneity in the parameters governing the spread of infectious diseases is a common feature of real-world epidemics. It has been suggested that for pathogens with basic reproductive number R(0)>1, increasing heterogeneity makes extinction of disease more likely during the early rounds of transmission. The basic reproductive number R(0) of the introduced pathogen may, however, be less than 1 after the introduction, and evolutionary changes are then required for R(0) to increase to above 1 and the pathogen to emerge. In this paper, we consider how host heterogeneity influences the emergence of both non-evolving pathogens and those that must undergo adaptive changes to spread in the host population. In contrast to previous results, we find that heterogeneity does not always make extinction more likely and that if adaptation is required for emergence, the effect of host heterogeneity is relatively small. We discuss the application of these ideas to vaccination strategies.


Figures

Figure 1
Figure 1
Implementation of heterogeneity in our model. We partition the host population into subsets with uniform infectivities and susceptibilities. The number of secondary cases, R0(ij), an infected individual in subpopulation i causes in an entirely susceptible subpopulation j is the product of the infectivity of an individual of type i, ηi, the mixing matrix of the two subsets, πij, and the susceptibility, σj, and frequency, fj, of the individuals of type j (see equation (2.2)). The dominant eigenvalue of R0(ij) is the basic reproductive number of the pathogen, R0.
Figure 2
Figure 2
The influence of host heterogeneity on the probability of emergence of a non-evolving pathogen. Grey line, the homogeneous case (equation (2.9)). (a) Each form of heterogeneity individually. Solid black line, a population comprising 10% superspreaders with 20-fold higher infectivity than normal; dotted line, dissortative mixing (q=0.05; see equation (3.1)) in a population split of 10–90%; and the dashed line, assortative mixing (q=0.95). Multiple subpopulations with different susceptibilities give rise to the same probability of emergence as the homogeneous case with the same R0 (grey line). (b) Combining heterogeneity in infectivity (solid black line) with heterogeneous mixing patterns. (c) Combining heterogeneity in susceptibility (grey line, which coincides with the homogeneous case) with heterogeneous mixing patterns.
Figure 3
Figure 3
The probability of one-step pathogen evolution and emergence occurring in the presence of host heterogeneity. The adaptation probability μ per transmission is 0.01. (a) The effect of the different forms of heterogeneity alone. Note that heterogeneity in susceptibility alone gives identical probability of emergence to the homogeneous case (grey line). Heterogeneous infectivity was modelled with 10% of the population as superspreaders with 20-fold higher infectivity than normal; susceptibility with 10% of the population 20 times more likely to contract the infection per contact; and assortative and dissortative mixing modelled with the parameter q=0.95 and 0.05, respectively. (b) Combining heterogeneity in infectivity and in mixing. (c) Combining heterogeneity in susceptibility and mixing.
Figure 4
Figure 4
Emergence of pathogens with different evolutionary characteristics in heterogeneous host populations. (a) One-step evolution (n=1) for different values of μ, the probability of adaptation per transmission. (b) Varying the number of adaptation events, n, required to reach the adapted strain with R0≫1. Intermediate strains have the same R0 as the original (introduced) strain. The probability of adaptation per transmission is fixed at μ=0.01. Grey line, the reference case of a homogeneous population. Solid black line, heterogeneity in infectivity (10% superspreaders with 20-fold higher infectivity than normal). Dashed line, heterogeneity in infectivity with assortative mixing (q=0.95) of the two spreader types. Dotted line, heterogeneity in infectivity with dissortative mixing (q=0.05).
Figure 5
Figure 5
Vaccination strategies in (a, c) homogeneous and (b, d) heterogeneous populations, without (a, b) and with (c, d) pathogen adaptation. Grey lines, the probability of disease emergence as a function of R0 in the unvaccinated population. Solid black lines, the effect of random vaccination programmes with different levels of coverage. Dotted black lines in (b, d), the effect of targeted vaccination with the same overall coverage, i.e. vaccinating all the superspreaders and applying the remaining vaccine resources randomly to the rest of the population. The heterogeneous population in (b, d) comprises 5% superspreaders with 10-fold higher infectivity than the remaining 95%. In (c, d) the pathogen requires a single adaptation step to gain a high value of R0 (here 10 000). In this case, the probability of emergence becomes the probability of evolution (see main text). In (a-d) we simulated both a ‘leaky’ vaccine, which reduces susceptibility in all recipients by 70%, and an ‘all-or-none’ vaccine that confers complete immunity on 70% of recipients and none on the remainder. These vaccines give identical results.
Figure 6
Figure 6
Comparing random and targeted vaccination strategies. We take a population comprising 5% superspreaders (10-fold more infectious than normal). For two values of R0 of the untreated population (2 and 4), we calculate the resulting values of R0 after vaccination with different levels of coverage (horizontal axis). Solid black line, the results of vaccinating randomly chosen individuals; dotted line, the effect of targeted vaccination, in which superspreaders are identified and vaccinated before normal spreaders. Grey horizontal line, the threshold, R0=1, below which emergence is not possible without pathogen evolution.

References

    1. Antia R, Regoes R.R, Koella J.C, Bergstrom C.T. The role of evolution in the emergence of infectious diseases. Nature. 2003;426:658–661. doi:10.1038/nature02104 - DOI - PMC - PubMed
    1. Ball F. The threshold behaviour of epidemic models. J. Appl. Probab. 1983;20:227–241. doi:10.2307/3213797 - DOI
    1. Ball F, Becker N.G. Control of transmission with two types of infection. Math. Biosci. 2006;200:170–187. doi:10.1016/j.mbs.2005.12.024 - DOI - PubMed
    1. Becker N. Estimation for discrete time branching processes with application to epidemics. Biometrics. 1977;3:515–522. doi:10.2307/2529366 - DOI - PubMed
    1. Becker N.G, Hall R. Immunization levels for preventing epidemics in a community of households made up of individuals of various types. Math. Biosci. 1996;132:205–216. doi:10.1016/0025-5564(95)00080-1 - DOI - PubMed

Publication types

MeSH terms