. 2006 Oct;26(20):7561-74.
doi: 10.1128/MCB.00605-06.

Peroxisome proliferator-activated receptor gamma regulates E-cadherin expression and inhibits growth and invasion of prostate cancer

Affiliations

Peroxisome proliferator-activated receptor gamma regulates E-cadherin expression and inhibits growth and invasion of prostate cancer

Jean-Sébastien Annicotte et al. Mol Cell Biol. 2006 Oct.

Abstract

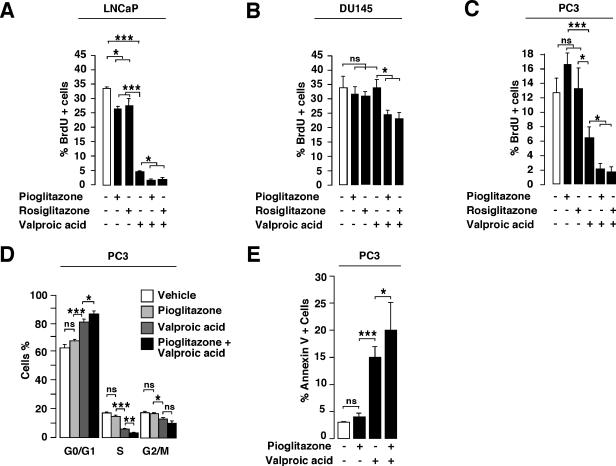
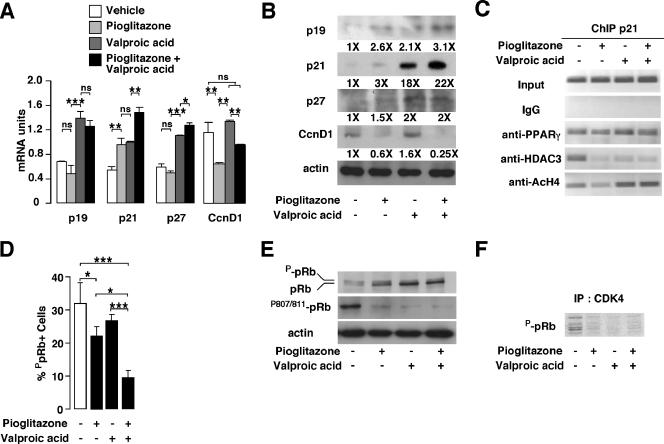
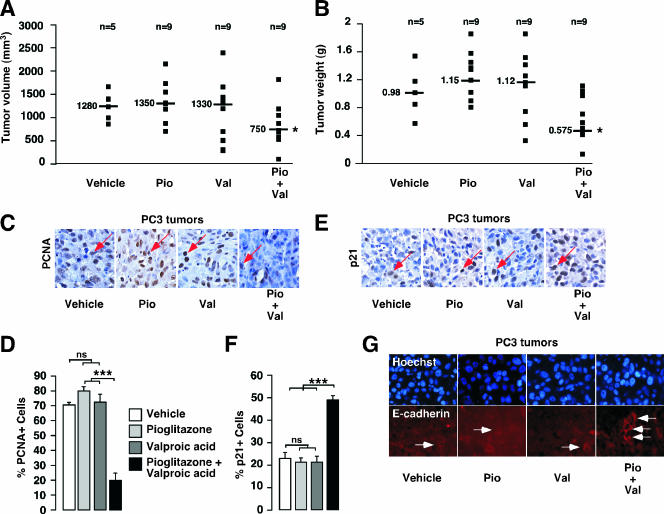
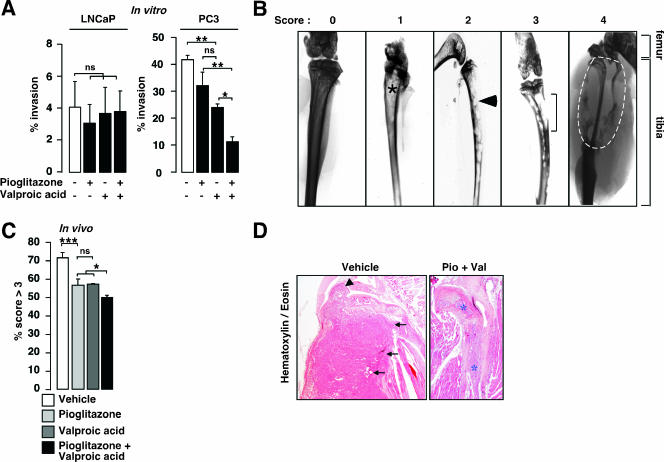
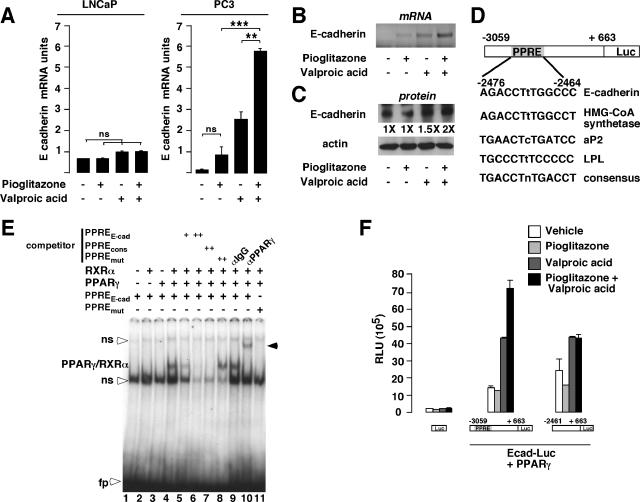
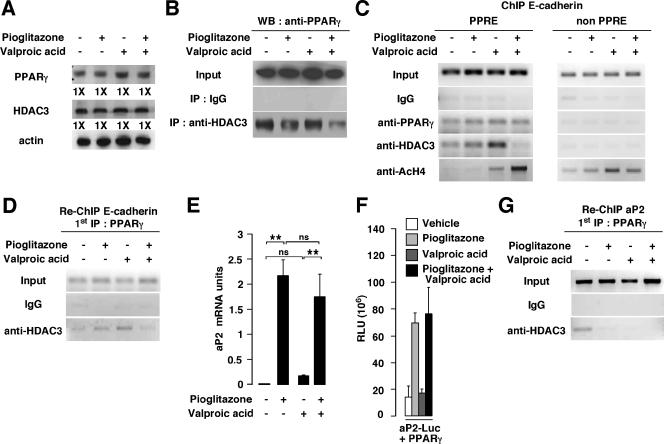
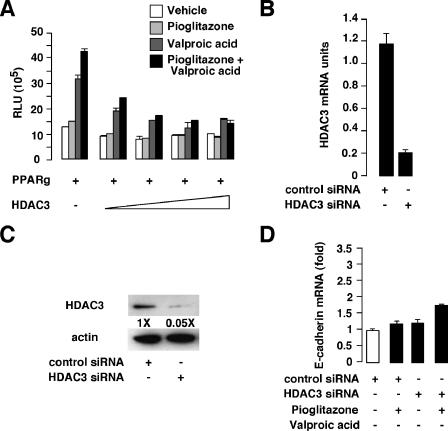
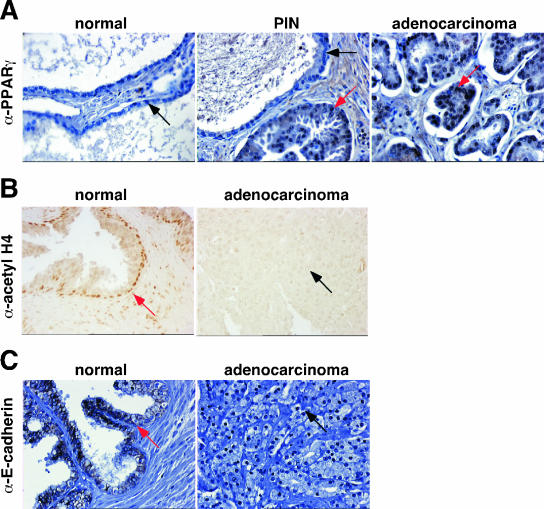
Peroxisome proliferator-activated receptor gamma (PPARgamma) might not be permissive to ligand activation in prostate cancer cells. Association of PPARgamma with repressing factors or posttranslational modifications in PPARgamma protein could explain the lack of effect of PPARgamma ligands in a recent randomized clinical trial. Using cells and prostate cancer xenograft mouse models, we demonstrate in this study that a combination treatment using the PPARgamma agonist pioglitazone and the histone deacetylase inhibitor valproic acid is more efficient at inhibiting prostate tumor growth than each individual therapy. We show that the combination treatment impairs the bone-invasive potential of prostate cancer cells in mice. In addition, we demonstrate that expression of E-cadherin, a protein involved in the control of cell migration and invasion, is highly up-regulated in the presence of valproic acid and pioglitazone. We show that E-cadherin expression responds only to the combination treatment and not to single PPARgamma agonists, defining a new class of PPARgamma target genes. These results open up new therapeutic perspectives in the treatment of prostate cancer.


Figures

FIG. 1.
FIG. 1.
Proliferation of prostate cancer cells in response to PPARγ agonists and HDAC inhibitor. (A to C) Quantification of BrdU incorporating LNCaP (A), DU145 (B), and PC3 (C) cells treated with vehicle (white bars), pioglitazone, rosiglitazone, valproic acid, or a combination of both PPARγ agonists and HDAC inhibitor. At least 500 cells were counted under a microscope. Asterisks indicate statistically significant results (analysis of variance; ns, not significant; *, 0.01 ≤ P < 0.05; **, 0.001 ≤ P < 0.01; ***, P < 0.001). (D) Flow cytometry analysis of PC3 cells in response to pioglitazone, valproic acid, or both. Fractions of cells in the G0/G1, S, or G2/M phases of the cell cycle are indicated. (E) Quantification of apoptosis of PC3 cells in response to pioglitazone, valproic acid, or both. +, presence of agonist or inhibitor (black bars); −, absence of agonist or inhibitor (white bars).
FIG. 2.
FIG. 2.
Analysis of cell cycle regulators in response to PPARγ agonist and HDAC inhibitor. (A) Quantification by Q-PCR of mRNA expression of the indicated genes in PC3 cells in response to pioglitazone, valproic acid, or both. Results were normalized for expression of RS9 mRNA. CcnD1, cyclin D1. (B) Immunoblotting of the indicated proteins in PC3 cells treated as indicated in panel A. The corresponding induction (n-fold) compared to that for nontreated cells is indicated below the image. (C) Results from ChIP assays, showing binding of PPARγ and HDAC3 to the human p21 promoter in a region containing sp1 sites and the presence of acetylated histone H4 in this region. PC3 cells were treated as indicated in panel A. (D) Quantification of pRb phosphorylation levels in PC3 cells following treatment as indicated (white bar, no treatment). At least 500 cells were counted under a fluorescence microscope for detection of phospho-pRb after use of an anti-phospho-Rb antibody. (E) Western blot analysis of PC3 whole-cell extracts treated as indicated in panel A. The proteins detected with specific antibodies are indicated. (F) CDK4 activity in PC3 cells. Results from sodium dodecyl sulfate-polyacrylamide gel electrophoresis autoradiography show phosphorylated, purified pRb by immunoprecipitated (IP) CDK4 from vehicle-, pioglitazone-, valproic acid-, and pioglitazone plus valproic acid-treated PC3 cells. See the legend for Fig. 1 for definitions of symbols.
FIG. 3.
FIG. 3.
In vivo analysis of tumor development in nude mice in response to pioglitazone and valproic acid after PC3 cell graft. (A and B) Volumes (A) and weights (B) of luminescent PC3 tumors in nude mice treated for 4 weeks with vehicle, pioglitazone (Pio), valproic acid (Val), or both (Pio+Val), as described in Materials and Methods. The number of mice used and the median value for each group are indicated. (C) Micrography representative of PCNA staining (red arrow) by IHC of tumor sections in mice treated with vehicle, pioglitazone, valproic acid, or both. (D) Quantification of PCNA staining represented in panel C. Four fields per section were analyzed for PCNA staining indicative of cell proliferation. Sections of tumors of all mice were analyzed. At least 500 cells were counted per tumor. (E) Micrography representative of p21 staining (red arrow) by IHC of tumor sections in mice treated with vehicle, pioglitazone, valproic acid, or both. (F) Quantification of p21 staining represented in panel E was obtained as described for panel D. (G) Micrography representative of E-cadherin staining by immunofluorescence (white arrow) of sections of tumors in mice treated with vehicle, pioglitazone, valproic acid, or both. See legend for Fig. 1 for definitions of other symbols.
FIG. 4.
FIG. 4.
Analysis of invasive potential of prostate cancer cells both in vitro and in vivo in response to valproic acid and pioglitazone treatments. (A) Invasive capacity of LNCaP and PC3 cells in Matrigel-coated membrane in response to pioglitazone, valproic acid, or both, as indicated. Percent invasion represents the proportion of plated cells that migrated through the membrane. White bars, no treatment. (B) Representative X-ray analysis and scores of the PC3-engrafted tibiae of SCID mice after 21 days of treatment with vehicle, pioglitazone, valproic acid, or a combination of pioglitazone and valproic acid. Xenografted tibiae were scored from 0 to 4 depending on the invasion degree: 0, no invasion; 1, weak and localized sign of invasion (asterisk); 2, regular features of invasion (arrowhead); 3, strong marks of bone destruction (bracket); 4, complete bone destruction (inside the white dotted line). Locations of femur and tibia bone structures are indicated. (C) Qualitative in vivo invasion analysis of X ray. X-ray radiographs were blindly scored for bone invasion potential, and results are presented as relative percentages of scores of >3. (D) Hematoxylin and eosin staining of intratibial tumors, demonstrating invasion of tumor cells from mice treated with vehicle in the join (large arrowhead) and in the skeletal muscle (small arrowheads), whereas PC3 tumors from pioglitazone plus valproic acid (Pio+Val)-treated mice remained in the bone cavity (asterisks). See legend for Fig. 1 for definitions of other symbols.
FIG. 5.
FIG. 5.
E-cadherin expression, in vitro binding by PPARγ/RXRα, and transactivation assays in response to pioglitazone and/or valproic acid treatments. (A) Quantification of mRNA expression by Q-PCR of the E-cadherin gene in LNCaP and PC3 cells in response to pioglitazone, valproic acid, or both. Results were normalized for expression of RS9 mRNA. (B) Semiquantitative RT-PCR imaging showing expression of the E-cadherin mRNA in PC3 cells in response to pioglitazone, valproic acid, or both. (C) Western blot analysis of PC3 whole-cell extracts treated as indicated in panel A. The proteins detected with specific antibodies and the levels of induction (n-fold) are indicated. (D) Computational analysis of the regulatory region of the human E-cadherin gene demonstrating the presence of a potential PPRE. Comparison of this PPRE with the PPREs of classical PPARγ target genes is illustrated. (E) In vitro binding of the PPARγ/RXRα heterodimer to the E-cadherin promoter. EMSA analysis of the radiolabeled PPRE of the E-cadherin promoter incubated with unprogrammed reticulocyte lysate (lane 1), in vitro-translated RXRα (lane 2), PPARγ (lane 3), or both (lane 4 to 11). Double-stranded cold oligonucleotides, representing the E-cadherin PPRE (PPREE-cad), the consensus PPRE (PPREcons), or the mutated E-cadherin PPRE (PPREmut), were included in the competition assays (lanes 5 to 8). Incubation of an anti-PPARγ antibody resulted in a supershifted band (lane 10, black arrowhead), whereas no modification in PPARγ/RXRα binding was observed with IgG (lane 9). No binding was observed when a radiolabeled mutated E-cadherin PPRE (PPREmut) was used as a probe (lane 11). ns, nonspecific binding; fp, free probe. (F) Pioglitazone and valproic acid treatments modulate E-cadherin promoter activity. Shown are relative luciferase activities as determined after cotransfection of COS cells with the PPARγ expression vector and the empty construct, the E-cadherin promoter construct, or the E-cadherin promoter deletion mutant reporter construct. Cells were treated as indicated. Luc, luciferase; HMG-CoA synthetase, 3-hydroxy-3-methylglutaryl coenzyme A synthetase; LPL, lipoprotein lipase; RLU, relative luciferase units; Ecad-Luc, E-cadherin luciferase reporter. See legend for Fig. 1 for definitions of symbols.
FIG. 6.
FIG. 6.
Differential HDAC3 recruitment and in vivo binding of PPARγ to the E-cadherin and aP2 promoters in response to pioglitazone and/or valproic acid treatments. (A) Western blot showing PPARγ and HDAC3 expression in PC3 cells treated with pioglitazone, valproic acid, or both. Induction (n-fold) is indicated. (B) Immunoprecipitation (IP) assays showing interaction between PPARγ and HDAC3. Extracts from PC3 cells treated with vehicle, pioglitazone, valproic acid, or both were immunoprecipitated with IgG or anti-HDAC3 or directly analyzed for the presence of PPARγ (Input). Western blot analysis revealed the presence of PPARγ in HDAC3 immunoprecipitates. (C) ChIP demonstrating binding of PPARγ and HDAC3 to the E-cadherin promoter. Cross-linked chromatin from PC3 cells treated with vehicle, pioglitazone, valproic acid, or both was incubated with antibodies against PPARγ, HDAC3, acetylated H4, or IgG. Immunoprecipitates were analyzed by PCR using specific primers for the PPRE present in the E-cadherin promoter (PPRE) or primers amplifying a region outside the PPRE (non PPRE). As a control, a sample representing 10% of the total chromatin was included in the PCR (Input). (D) Re-ChIP assays demonstrating interaction between HDAC3 and PPARγ on the E-cadherin promoter. Chromatin prepared from PC3 cells treated with vehicle, pioglitazone, valproic acid, or both was subjected to the ChIP procedure with the antibody against PPARγ and reimmunoprecipitated using IgG or anti-HDAC3 antibody. Immunoprecipitates were analyzed as described for panel C. (E) Quantification of mRNA expression by Q-PCR of the aP2 gene in PC3 cells in response to pioglitazone, valproic acid, or both. Results were normalized for expression of RS9 mRNA. (F) Activity generated by the aP2 luciferase (aP2-Luc) reporter cotransfected with the PPARγ expression vector. Experiments were performed either without stimulation (vehicle) or in the presence of pioglitazone, valproic acid, or both. (G) Re-ChIP assays demonstrating interaction between HDAC3 and PPARγ on the aP2 promoter. Chromatin was prepared and subjected to the Re-ChIP procedure as described for panel D. Immunoprecipitates were analyzed using primers specific for the aP2 promoter. WB, Western blot; RLU, relative luciferase units. See the legend for Fig. 1 for definitions of symbols.
FIG. 7.
FIG. 7.
Effects of HDAC3 overexpression on the E-cadherin promoter and HDAC3 knockdown on E-cadherin mRNA in response to pioglitazone. (A) Activity generated by the E-cadherin luciferase reporter cotransfected with the PPARγ expression vector and increasing amounts of the HDAC3 expression vector. Experiments were performed without stimulation (vehicle) or in the presence of pioglitazone, valproic acid, or both. (B and C) Q-PCR (B) and Western blot (C) analysis showing knockdown expression of HDAC3 expression in PC3 cells transfected with a control or HDAC3 siRNA. In panel C, levels of induction (n-fold) are indicated. (D) Quantitative real-time PCR showing E-cadherin gene expression in control versus HDAC3 knockdown in PC3 cells treated as indicated. RLU, relative luciferase units; +, presence of agonist or inhibitor; −, absence of agonist or inhibitor (white bar).
FIG. 8.
FIG. 8.
Analysis of PPARγ, histone H4 acetylation, and E-cadherin expression in human normal and neoplastic prostates. (A) Micrography representative of human PPARγ staining (red arrows) by IHC of sections of normal prostate, prostatic intraepithelial neoplasia (PIN), and prostatic adenocarcinoma. Weak to no staining (black arrows) was observed in normal prostatic gland. (B) Micrography representative of acetylated histone H4 staining (red arrow) by IHC of sections of normal prostatic gland and prostatic adenocarcinoma. No immunostaining (black arrow) was observed in prostatic adenocarcinoma. (C) Micrography representative of human E-cadherin staining by IHC of tissue microarray sections of normal prostate and prostatic adenocarcinoma obtained after radical prostatectomy. Strong staining was observed in normal prostate (red arrow), whereas no staining (black arrow) was observed in adenocarcinoma.

References

    1. Abella, A., P. Dubus, M. Malumbres, S. G. Rane, H. Kiyokawa, A. Sicard, F. Vignon, D. Langin, M. Barbacid, and L. Fajas. 2005. Cdk4 promotes adipogenesis through PPARgamma activation. Cell Metab. 2:239-249. - PubMed
    1. Annicotte, J. S., C. Chavey, N. Servant, J. Teyssier, A. Bardin, A. Licznar, E. Badia, P. Pujol, F. Vignon, T. Maudelonde, G. Lazennec, V. Cavailles, and L. Fajas. 2005. The nuclear receptor liver receptor homolog-1 is an estrogen receptor target gene. Oncogene 24:8167-8175. - PMC - PubMed
    1. Annicotte, J. S., E. Fayard, G. H. Swift, L. Selander, H. Edlund, T. Tanaka, T. Kodama, K. Schoonjans, and J. Auwerx. 2003. Pancreatic-duodenal homeobox 1 regulates expression of liver receptor homolog 1 during pancreas development. Mol. Cell. Biol. 23:6713-6724. - PMC - PubMed
    1. Butler, R., S. H. Mitchell, D. J. Tindall, and C. Y. Young. 2000. Nonapoptotic cell death associated with S-phase arrest of prostate cancer cells via the peroxisome proliferator-activated receptor gamma ligand, 15-deoxy-delta12,14-prostaglandin J2. Cell Growth Differ. 11:49-61. - PubMed
    1. Cano, A., M. A. Perez-Moreno, I. Rodrigo, A. Locascio, M. J. Blanco, M. G. del Barrio, F. Portillo, and M. A. Nieto. 2000. The transcription factor snail controls epithelial-mesenchymal transitions by repressing E-cadherin expression. Nat. Cell Biol. 2:76-83. - PubMed

Publication types

MeSH terms