. 2006 Oct 9;175(1):135-46.
doi: 10.1083/jcb.200605012. Epub 2006 Oct 2.

Cdc42 GEF Tuba regulates the junctional configuration of simple epithelial cells

Affiliations

Cdc42 GEF Tuba regulates the junctional configuration of simple epithelial cells

Tetsuhisa Otani et al. J Cell Biol. .

Abstract

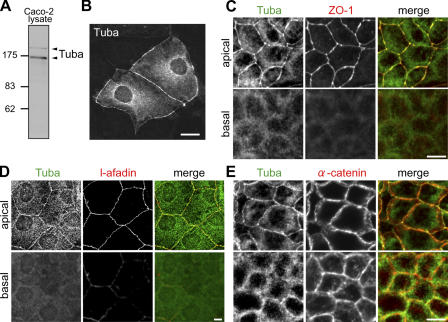
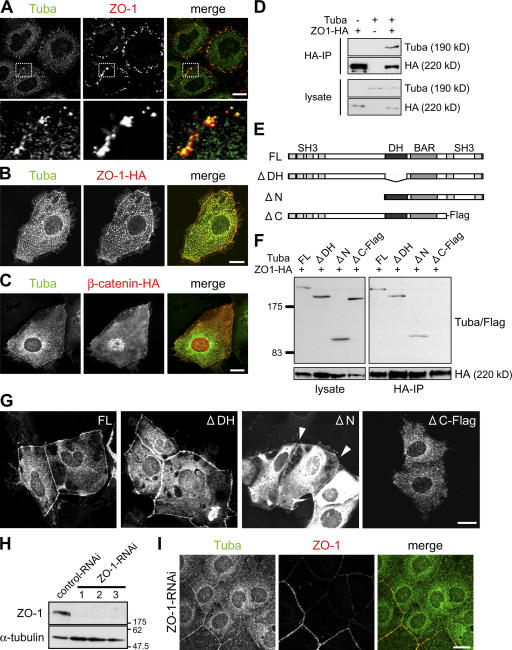
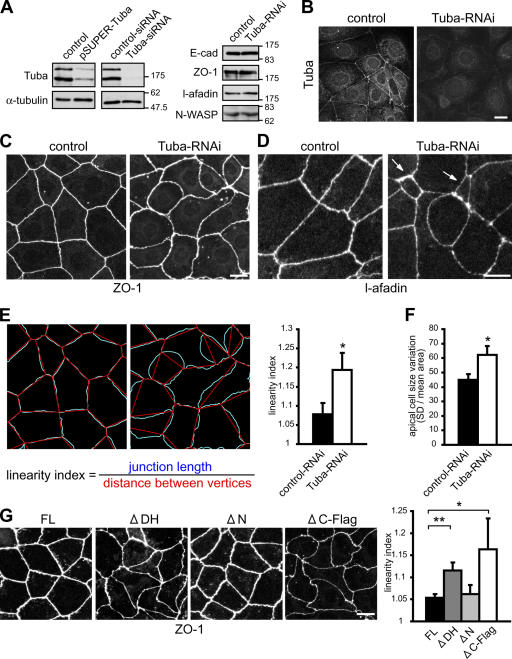
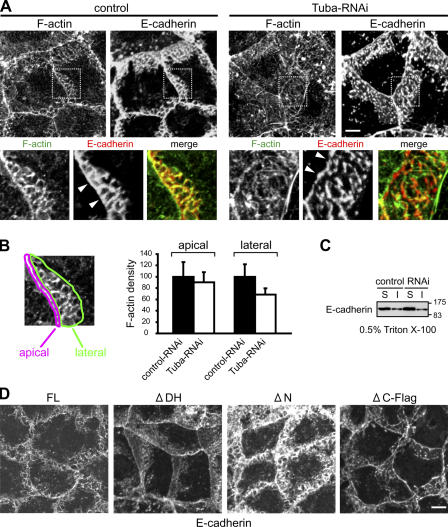
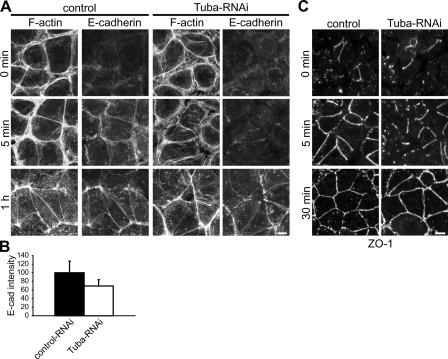
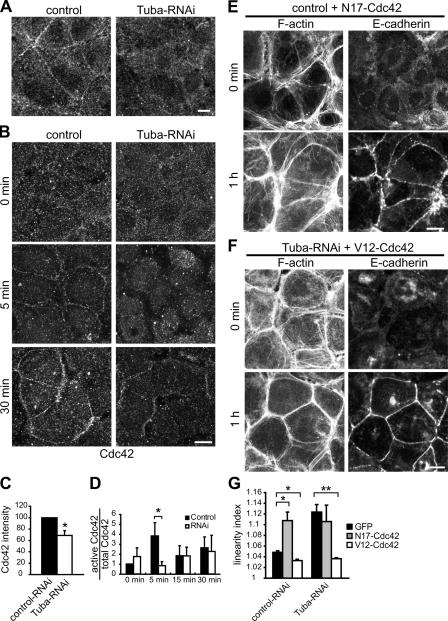
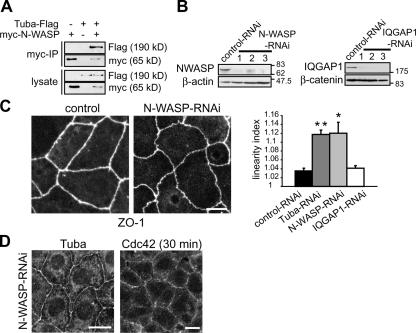
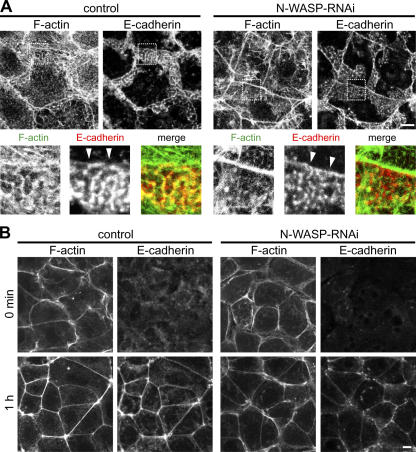
Epithelial cells are typically arranged in a honeycomb-like pattern, minimizing their cell-cell contact areas, which suggests that some tension operates for shaping of the cell boundaries. However, the molecular mechanisms that generate such tension remain unknown. We found that Tuba, which is a Cdc42-specific GEF, was concentrated at the apical-most region of cell junctions in simple epithelia via its interaction with ZO-1. RNAi-mediated depletion of Tuba altered the geometrical configuration of cell junctions, resulting in a curved and slack appearance. At the subcellular level, Tuba inactivation modified the assembly pattern of junctional F-actin and E-cadherin. Tuba RNAi also retarded cell junction formation in calcium-switch experiments. Suppression of Cdc42 activity or depletion of N-WASP, which is an effector of Cdc42, mimicked the effects of Tuba depletion. Conversely, overexpression of dominant-active Cdc42 or N-WASP enhanced the junction formation of Tuba-depleted cells. These results suggest that Tuba controls the shaping of cell junctions through the local activation of Cdc42 and its effectors.


Figures

Figure 1.
Figure 1.
Localization of Tuba at the apical cell–cell junctions in Caco-2 cells. (A) Immunoblot detection of Tuba from a Caco-2 cell lysate with anti-Tuba mAb. Two isoforms, of 190 and 170 kD, are detected. (B) Cell junctional signals of Tuba are increased by its exogenous expression. Compare the immunofluorescence signals along cell junctions between the centrally located transfectants and surrounding nontransfectants. (C–E) Endogenous Tuba is concentrated at the apical region of cell junctions. Cells were coimmunostained for Tuba and ZO-1 (C), l-afadin (D), or αE-catenin (α-catenin) (E). Tuba is colocalized with ZO-1, l-afadin, and the apical-most population of αE-catenin (α-catenin). Bars: (B) 20 μm; (C–E) 10 μm.
Figure 2.
Figure 2.
Tuba is recruited to cell–cell junctions with ZO-1. (A) Tuba and ZO-1 are colocalized with each other even after disorganization of cell–cell contacts. Caco-2 cells were cultured in low-calcium medium and coimmunostained for Tuba and ZO-1. (B and C) Clusters of overexpressed Tuba are colocalized with ZO-1 (B), but not with β-catenin (C). (D) Tuba coimmunoprecipitates with ZO-1. Tuba and ZO-1-HA were coexpressed in human embryonic kidney 293 cells; and ZO-1 was immunoprecipitated from their lysates with anti-HA antibody, and then the coprecipitated molecules were identified by immunoblotting. (E) Schematic diagram of deletion mutants of Tuba used in this study. From the N-terminus, Tuba consists of four Src homology 3 (SH3) domains, a DH domain, a Bin1/amphiphysin/Rvs (BAR) domain, and two SH3 domains. Flag tag was attached only to ΔC. For immunodetection of Tuba or its mutants, we generally used the anti-Tuba mAb, which had been generated against the C-terminal portion of Tuba. For detection of ΔC, we used anti-Flag antibodies. (F) Tuba C terminus is required for the interaction between Tuba and ZO-1. Deletion mutants of Tuba were coexpressed with ZO-1, and their coprecipitates were assayed as in D. Bands were detected by using a mixture of mAbs against Tuba and Flag tag. (G) Tuba C terminus is required for junctional localization. FL, ΔDH, and ΔN are localized at cell junctions (arrowheads), as well as in the cytoplasm, whereas ΔC is detected only in the cytoplasm. (H and I) Junction localization of Tuba is abolished in ZO-1 knockdown cells. Expression of ZO-1 was knocked down in Caco-2 cells by siRNA (H). ZO-1 RNAi cells were coimmunostained for Tuba and ZO-1 (I). Similar results were obtained by using three different siRNAs, siZO-1-1–3. Bars, 20 μm.
Figure 3.
Figure 3.
Tuba regulates the junctional configuration. (A) Immunoblot detection of Tuba from control, pSUPER-Tuba–transfected, and Tuba siRNA–treated cells by use of anti-Tuba mAb. (B) Immunostaining of control and pSUPER-Tuba–transfected cells with anti-Tuba mAb. (C and D) Distorted apical junctions in Tuba-RNAi cells. Control and Tuba-RNAi cells were stained for ZO-1 (C) or l-afadin (D). In Tuba-RNAi cells, the apical junctions are more irregularly curved than in the controls. Some cells exhibit abnormally small apical surface areas, as outlined by these markers (arrows). (E) Quantification of junction linearity. Junction length (blue) and the distance between vertices (red) were measured. Linearity index is defined by the ratio of junction length to the distance between vertices. (right) This index increases in Tuba-RNAi cells. *, P < 0.05. n = 3 independent experiments, in each of which >150 junctions were measured; t test. (F) Apical area is more variable in Tuba-RNAi cells. The apical area of each cell was measured, and the ratio of the SD of apical area to mean apical area was quantified. *, P < 0.05; n = 3 independent experiments, in each of which >100 cells were measured; t test. (G) Cell junction outlines are distorted in ΔDH- or ΔC-expressing cells, but not in FL- or ΔN-expressing ones. Stable transfectants were immunostained for ZO-1. (right) Quantification confirms these differences. Error bars represent the mean ± the SD. *, P < 0.05; **, P < 0.001. n = 4 independent experiments, in each of which >30 junctions were measured; t test. Bars, 20 μm.
Figure 4.
Figure 4.
Disorganization of F-actin and E-cadherin networks by Tuba suppression. (A) Double-staining for F-actin (green) and E-cadherin (red). F-actin and E-cadherin form an AJ at the apical-most margin of the junction (arrowheads), and the AJ is linked with the lateral networks of these molecules in the case of control cells. In Tuba-RNAi cells, F-actin appears to have been dispersed at the lateral portions, and the E-cadherin networks have become fragmented and discontinuous with the AJ; the colocalization of E-cadherin and F-actin is also reduced. (B) Quantification of F-actin density at cell junctions. (left) F-actin density at apical and lateral cell junctions was measured as shown. (right) Quantification shows that lateral F-actin density is reduced in Tuba-RNAi cells. Error bars represent the mean ± the SD. n > 40 junctions. (C) Triton X-100 solubility of E-cadherin is not altered in Tuba-RNAi cells. S, soluble fraction; I, insoluble fraction. (D) Effects of Tuba deletion mutants on E-cadherin distribution. Immunostaining for E-cadherin shows that, in ΔDH- or ΔC-expressing cells, E-cadherin localization at lateral cell–cell contacts is more diffuse compared with that in FL-expressing cells. In ΔN-expressing cells, E-cadherin was most highly concentrated at lateral cell–cell contacts. Bars, 10 μm.
Figure 5.
Figure 5.
Junctional recruitment of F-actin and E-cadherin after calcium switch. (A) Cells were cultured in low-calcium medium overnight, and then cadherin-mediated junction assembly was initiated by the addition of calcium. In Tuba-RNAi cells, the relocation of E-cadherin to cell junctions was retarded, and F-actin could not be reorganized into sharp lines at cell–cell boundaries by 1 h. (B) Immunofluorescence intensity of E-cadherin at cell junctions was quantified for the samples incubated for 5 min with calcium. Error bars represent the mean ± the SD. n = 60 junctions. (C) ZO-1 relocation to cell junctions was not severely effected in Tuba-RNAi cells. Bars, 10 μm.
Figure 6.
Figure 6.
Role of Cdc42 in junction assembly. (A) Cdc42 is localized at cell–cell boundaries, and this localization is diminished in Tuba-RNAi cells. (B and C) Delayed redistribution of Cdc42 to Tuba-RNAi cell junctions in calcium-switch experiments. Cdc42 was immunostained at the indicated times after calcium restoration (B). Immunofluorescence intensity of Cdc42 at cell junctions was quantified for the samples incubated for 30 min (C), in which the intensity of control-RNAi cells was adjusted to 100. Error bars represent the mean ± the SD. *, P < 0.05. n = 3 independent experiments, in each of which >10 junctions were measured; paired t test. (D) Delayed activation of Cdc42 in Tuba-RNAi cells. After Cdc42 pull-down assays using GST-PAK-CRIB, the intensity of electrophoretic bands of Cdc42 was quantified. In brief, each band was encircled by a box, and the signal density of the band was measured. The ratio of the Cdc42 signals in GST-PAK-CRIB pull-down samples to those in the total lysates was defined as “active Cdc42/total Cdc42.” The ratio in control-RNAi cells at 0 min was adjusted to 1. Error bars represent the mean ± the SEM. *, P < 0.05; n = 3 independent experiments; one-tailed t test. (E and F) Effects of Cdc42 mutants on junction assembly in calcium-switch assays. Dominant-negative (N17-Cdc42) or constitutive-active (V12-Cdc42) Cdc42 was expressed in control or in Tuba-RNAi cells. In N17-Cdc42–transfected control cells (E), the junctional recruitment of F-actin and E-cadherin was delayed (compare with Fig. 5). (F) In contrast, V12-Cdc42 strongly promoted the junctional accumulation of these molecules in Tuba-RNAi cells. (G) Linearity index in control or Tuba-RNAi cells, expressing either GFP (control) or dominant-negative or constitutive-active Cdc42, measured at 1 h. Error bars represent the mean ± the SD. *, P < 0.005; **, P < 0.0005. n = 3 independent experiments, in each of which >40 junctions were measured; t test. Bars: (A) 10 μm; (B, E, and F) 20 μm.
Figure 7.
Figure 7.
Role of N-WASP in junctional configuration. (A) Tuba interacts with N-WASP. Tuba and myc-N-WASP were coexpressed in human embryonic kidney 293 cells, N-WASP was immunoprecipitated from their lysates with anti-myc antibody, and the coprecipitated molecules were identified by immunoblotting. (B, left) Immunoblot detection of N-WASP from control and N-WASP–RNAi cells with anti–N-WASP antibody. (right) Immunoblot detection of IQGAP1 from control and IQGAP1-RNAi cells with anti-IQGAP1 antibody. (C) Distortion of cell–cell boundaries in N-WASP–RNAi cells, detected by ZO-1 immunostaining. (right) Linearity index. Error bars represent the mean ± the SD. *, P < 0.005. **, P < 0.0005. n = 3 independent experiments, in each of which >100 junctions were measured; t test. (D) Localization of Tuba and Cdc42 is not altered in N-WASP–RNAi cells. (left) Tuba localization in confluent N-WASP–RNAi cells. (right) Cdc42 localization in N-WASP–RNAi cells at 30 min after calcium restoration. Bars, 20 μm.
Figure 8.
Figure 8.
Role of N-WASP in cadherin or actin distribution. (A) Double-staining for F-actin (green) and E-cadherin (red) in N-WASP–RNAi cells. Arrowheads indicate the AJ. Note the diffuse actin signals at the lateral cell junctions, and reduced colocalization of F-actin and E-cadherin, in N-WASP–RNAi cells. Actin fibers along the AJ appear normal. (B) Control and N-WASP–RNAi cells were subjected to calcium-switch assays and stained for F-actin or E-cadherin. N-WASP depletion delayed cell junction assembly. Linear reorganization of actin filaments was impaired, and E-cadherin accumulation was irregular at 1 h. Bars, 10 μm.

References

    1. Amano, M., M. Ito, K. Kimura, Y. Fukata, K. Chihara, T. Nakano, Y. Matsuura, and K. Kaibuchi. 1996. Phosphorylation and activation of myosin by Rho-associated kinase (Rho-kinase). J. Biol. Chem. 271:20246–20249. - PubMed
    1. Ando-Akatsuka, Y., S. Yonemura, M. Itoh, M. Furuse, and S. Tsukita. 1999. Differential behavior of E-cadherin and occludin in their colocalization with ZO-1 during the establishment of epithelial cell polarity. J. Cell. Physiol. 179:115–125. - PubMed
    1. Benais-Pont, G., A. Punn, C. Flores-Maldonado, J. Eckert, G. Raposo, T.P. Fleming, M. Cereijido, M.S. Balda, and K. Matter. 2003. Identification of a tight junction–associated guanine nucleotide exchange factor that activates Rho and regulates paracellular permeability. J. Cell Biol. 160:729–740. - PMC - PubMed
    1. Blanchoin, L., K.J. Amann, H.N. Higgs, J.B. Marchand, D.A. Kaiser, and T.D. Pollard. 2000. Direct observation of dendritic actin filament networks nucleated by Arp2/3 complex and WASP/Scar proteins. Nature. 404:1007–1011. - PubMed
    1. Bokoch, G.M., B.P. Bohl, and T.H. Chuang. 1994. Guanine nucleotide exchange regulates membrane translocation of Rac/Rho GTP-binding proteins. J. Biol. Chem. 269:31674–31679. - PubMed

Publication types

MeSH terms