. 2006 Oct 9;175(1):25-31.
doi: 10.1083/jcb.200605194. Epub 2006 Oct 2.

Kinesin-13s form rings around microtubules

Affiliations

Kinesin-13s form rings around microtubules

Dongyan Tan et al. J Cell Biol. .

Abstract

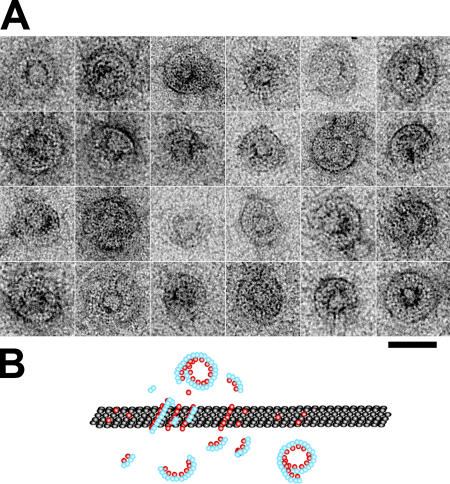
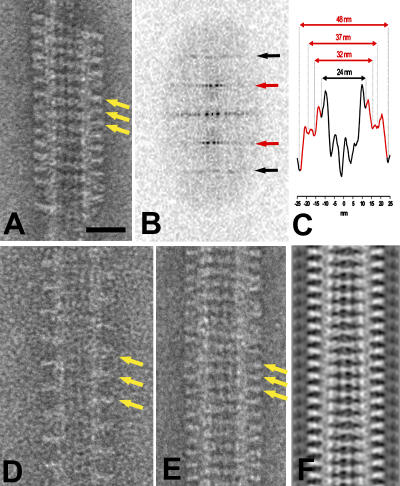
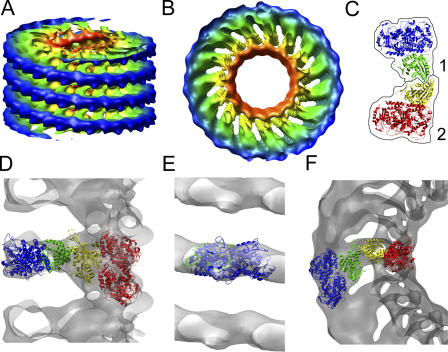
Kinesin is a superfamily of motor proteins that uses the energy of adenosine triphosphate hydrolysis to move and generate force along microtubules. A notable exception to this general description is found in the kinesin-13 family that actively depolymerizes microtubules rather than actively moving along them. This depolymerization activity is important in mitosis during chromosome segregation. It is still not fully clear by which mechanism kinesin-13s depolymerize microtubules. To address this issue, we used electron microscopy to investigate the interaction of kinesin-13s with microtubules. Surprisingly, we found that proteins of the kinesin-13 family form rings and spirals around microtubules. This is the first report of this type of oligomeric structure for any kinesin protein. These rings may allow kinesin-13s to stay at the ends of microtubules during depolymerization.


Figures

Figure 1.
Figure 1.
Electron micrograph gallery of microtubules with kinesin-13 rings. (A) Protein constructs used with their MDs aligned. Kinesin-1 amino acid sequence numbers correspond to human Kif5b. The MDs are indicated in solid blue for kinesin-1 and red for the kinesin-13s. The neck domain is yellow. (B) Rings formed by KLP10A MD + neck construct in the presence of AMPPNP on taxol-stabilized microtubules. (C) KLP10A MD-only construct in the presence of AMPPNP on taxol-stabilized microtubules. (D) KLP59C MD + neck construct in the presence of AMPPNP on taxol-stabilized microtubules. (E) KLP10A MD-only construct in the presence of AMPPNP on GMPCPP-stabilized microtubules. (F) MCAK MD + neck construct on taxol-stabilized microtubules. Bar, 50 nm.
Figure 2.
Figure 2.
Rings formed by free tubulin and kinesin-13s. (A) Gallery of selected ring structures. These rings were obtained by incubating free tubulin with the KLP10A MD-only construct. Bar, 42 nm. (B) Depiction of a possible pathway for ring formation. Kinesin-13s (red) interact with free tubulin (blue), forming ring-like structures that bind microtubules (black).
Figure 3.
Figure 3.
Kinesin-13 spirals. (A) A spiral formed by the KLP10A MD-only construct on taxol-stabilized microtubules. Yellow arrows indicate the shallow pitch tubulin helical paths followed by the spirals. (B) 2D power spectrum of A reveals strong layer line at orders of 1/8 nm−1 (red arrows, 1/8 nm−1; black arrows, 1/4 nm−1), indicating that the spirals follow the same axial repeat as the αβ tubulin heterodimer (8 nm). (C) Density profile projected along the microtubule axis (corresponding to microtubule in A). Portions of the profile attributed to the rings are red. Rings extend ∼12 nm from the microtubule surface. Three density peaks can be recognized in the ring areas (red). (D) KLP10A MD-only spiral following a single tubulin helical path. The pitch is 16 nm, indicating that the spiral follows one of the two-start tubulin helical paths on the microtubule. (E) KLP10A MD-only spiral formed on a 15-protofilament microtubule. (F) Lateral density projection of a 3D reconstruction of a spiral-microtubule specimen like the one showed in E. Bar, 25 nm.
Figure 4.
Figure 4.
Kinesin-13 spirals 3D reconstruction. (A) Slightly tilted side view of a surface representation of the calculated 3D density map corresponding to spirals of KLP10A MD-only constructs on 15-protofilament microtubules. The surface is color coded according to the radial distance from the helical axis. (Colors ordered red, yellow, green, and blue according to radial position from microtubule axis). (B) End-on view of the surface representation of the 3D density map. Color coded as in A. (C) Crystal structures of two kinesin tubulin complexes (Protein Data Bank accession no. 1IA0; Kikkawa et al., 2001). Each of the two complexes is outlined by a black contouring line. Tubulin heterodimers are blue in one complex and red in the other. The kinesin MD is green in one complex and yellow in the other. The molecules are colored to match their radial position within the 3D map after fitting. (D) Side view of the electron density map (clear gray) with the two kinesin–tubulin complexes fitted in one of the map asymmetric units. Densities corresponding to other asymmetric units in the front and back have been omitted for clarity. (E) Front view of the outer ring densities with fitted tubulin heterodimer molecule. (F) End-on view of the electron density with fitted molecules inside.
Figure 5.
Figure 5.
Kinesin-13 and tubulin labeled depolymerizing microtubules in S2 cells. (A) Sequence of video frames (1-s intervals) showing a depolymerizing microtubule at the cell periphery coated with expressed EGFP-KLP59C. As the microtubule depolymerizes, fluorescence at its end (red arrow) increases. A bright fluorescent punctum is left behind (green arrows) as the microtubule continues depolymerization. (B) Depiction of an interpretation of the events observed in A. EGFP-KP59C binds along the microtubule, making it fluorescent. EGFP-KLP59C on the depolymerizing microtubule is pushed and accumulates at the end, causing an increase in fluorescence. When a group or oligomer of KLP59C is released from the microtubule, fluorescence drops abruptly. (C) Fluorescence intensity versus time and microtubule length change versus time for the EGFP-KLP59C–labeled microtubule shown in A. The red line is fluorescence intensity at the depolymerizing end. The blue line is fluorescence intensity at an arbitrary point along the microtubule away from the depolymerizing end. The green line is the microtubule length change. The black arrow above the red line (at time = 8 s) marks the point at which a bright fluorescence punctum was released from the microtubule. (D) Another example with conditions the same as in C. (E) Fluorescence intensity of a depolymerizing microtubule in EGFP-tubulin–expressing cells but without kinesin-13 overexpression.

Similar articles

Cited by

References

    1. Carragher, B., M. Whittaker, and R.A. Milligan. 1996. Helical processing using PHOELIX. J. Struct. Biol. 116:107–112. - PubMed
    1. DeRosier, D.J., and P.B. Moore. 1970. Reconstruction of three-dimensional images from electron micrographs of structures with helical symmetry. J. Mol. Biol. 52:355–369. - PubMed
    1. Desai, A., and C.E. Walczak. 2001. Assays for microtubule-destabilizing kinesins. Methods Mol. Biol. 164:109–121. - PubMed
    1. Desai, A., S. Verma, T.J. Mitchison, and C.E. Walczak. 1999. Kin I kinesins are microtubule-destabilizing enzymes. Cell. 96:69–78. - PubMed
    1. Ganem, N.J., and D.A. Compton. 2004. The KinI kinesin Kif2a is required for bipolar spindle assembly through a functional relationship with MCAK. J. Cell Biol. 166:473–478. - PMC - PubMed

Publication types