. 2006 Oct 9;175(1):111-20.
doi: 10.1083/jcb.200606058. Epub 2006 Oct 2.

BMP1 controls TGFbeta1 activation via cleavage of latent TGFbeta-binding protein

Affiliations

BMP1 controls TGFbeta1 activation via cleavage of latent TGFbeta-binding protein

Gaoxiang Ge et al. J Cell Biol. .

Abstract

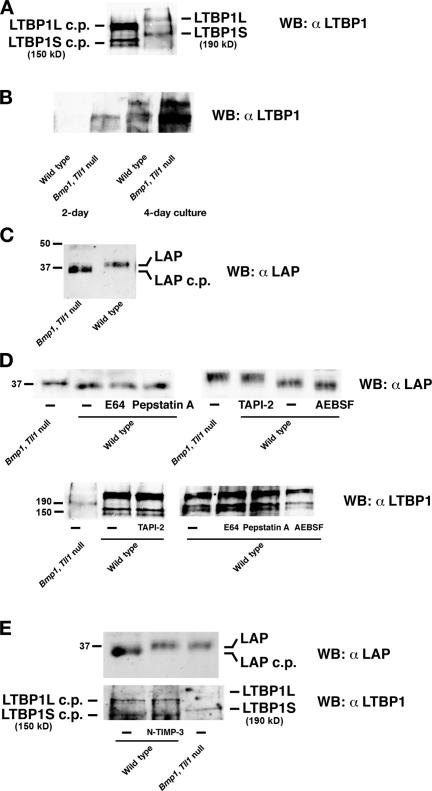
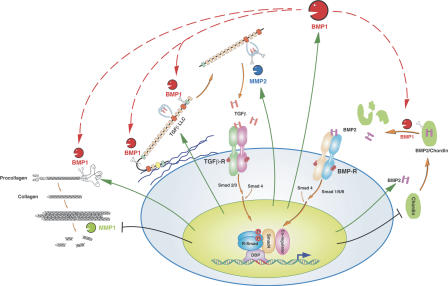
Transforming growth factor beta1 (TGFbeta1), an important regulator of cell behavior, is secreted as a large latent complex (LLC) in which it is bound to its cleaved prodomain (latency-associated peptide [LAP]) and, via LAP, to latent TGFbeta-binding proteins (LTBPs). The latter target LLCs to the extracellular matrix (ECM). Bone morphogenetic protein 1 (BMP1)-like metalloproteinases play key roles in ECM formation, by converting precursors into mature functional proteins, and in morphogenetic patterning, by cleaving the antagonist Chordin to activate BMP2/4. We provide in vitro and in vivo evidence that BMP1 cleaves LTBP1 at two specific sites, thus liberating LLC from ECM and resulting in consequent activation of TGFbeta1 via cleavage of LAP by non-BMP1-like proteinases. In mouse embryo fibroblasts, LAP cleavage is shown to be predominantly matrix metalloproteinase 2 dependent. TGFbeta1 is a potent inducer of ECM formation and of BMP1 expression. Thus, a role for BMP1-like proteinases in TGFbeta1 activation completes a novel fast-forward loop in vertebrate tissue remodeling.


Figures

Figure 1.
Figure 1.
BMP1 cleaves LTBP-1, but not LAP, in vitro. TGFβ1 LLC was incubated in the absence (−) or presence of low (25 ng) or high (250 ng) amounts of BMP1, and cleavage monitored by Western blots was probed with antibody to the C-terminal His tag of LTBP1 (A) or with anti-LTBP1 antibody (B). (C) A schematic is shown of LTBP1. H, hybrid domain; C1–3, 8-cysteine domains 1–3. Green boxes indicate non-Ca2+ binding EGF-like repeats, light orange boxes indicate Ca2+ binding EGF-like repeats, and the scissors indicate BMP1 cleavage sites. LAP (blue) is shown disulfide bonded to the C2 domain, and active TGFβ (dark orange) is shown noncovalently bound to LAP. (D) Alignment of LTBP1 cleavage sites with cleavage sites of known substrates of BMP1-like proteinases. Aspartates present at the P1′ sites of most cleavage sites of BMP1-like proteinases are in red, whereas other residues enriched near cleavage sites of known substrates of BMP1-like proteinases are in green. (E and F) TGFβ1 LLC was incubated in the absence (−) or presence (+) of BMP1, with samples analyzed by SDS-PAGE under reducing (E) or nonreducing (F) conditions, followed by Western blot analysis with anti-LAP antibodies. Numbers to the sides of blots correspond to the positions and approximate sizes in kD of molecular mass markers or known protein bands. In some cases, the molecular masses of known proteins are noted parenthetically next to the name of the protein. SM, starting material.
Figure 2.
Figure 2.
LLCs are not proteolytically processed in cultures of MEFs doubly homozygous null for the Bmp1 and Tll1 genes. Western blot analysis with anti-LTPB1 antibodies was used to monitor proteolytic processing of LTBP1 to LTBP1 cleavage products (cp) in conditioned media from 4-d cultures of wild-type or Bmp1/Tll1 doubly null MEFs (A) or monitor amounts of LTBP1 released by plasmin from ECM of 2- or 4-d wild-type or Bmp1/Tll1 doubly null MEF cultures (B). (C) Western blot analysis with anti-LAP antibodies was used to monitor LAP proteolytic processing in conditioned media from 4-d wild-type or Bmp1/Tll1 doubly null MEF cultures. (D) Western blot analyses were used to monitor proteolytic processing of LAP and LTBP1 in conditioned media of wild-type MEFs cultured in the presence of inhibitors of metallo- (TAPI-2), cysteine- (E64), aspartic- (pepstatin A), and serine- (AEBSF) proteinases. (E) Western blot analyses with anti-LAP and anti-LTBP1 antibodies shows that the inhibitory N-terminal domain of TIMP-3 (N-TIMP-3) inhibits processing of LAP, but not LTBP1, in wild-type MEF cultures. Numbers to the left of blots correspond to the positions and approximate sizes in kD of molecular mass markers or known protein bands. In some cases, the molecular masses of known proteins are noted parenthetically next to the name of the protein.
Figure 3.
Figure 3.
LAP cleavage is MMP2 dependent. (A) Levels of MMP2, MMP9, MMP14, or GAPDH RNA were compared by RT-PCR. Sizes of cDNA bands in bp are noted in brackets to the right of the panel. Western blot analysis using anti-proMMP2, anti-MMP9, or anti-PCOLCE1 antibodies (B) or anti–phospho-Smad2/3 or anti-tubulin antibodies (D) was performed on samples from wild-type MEFs subjected to RNAi knock down of MMP2, -9, or -14, or using a scrambled RNAi duplex control. (C) Western blot analysis with anti-LAP or anti-LTBP1 antibodies was performed on samples from Bmp1/Tll1 doubly null MEFs or from wild-type MEFs subjected to RNAi knock down of MMP2, -9, or -14, or using a scrambled RNAi duplex control. Western blot analysis with anti-LAP antibodies was performed on SLC (E) or on LLC (F and G) incubated with (+) or without (−) MMP2. In F and G, MMP2 cleavage was subsequent to incubation in the presence (+) or absence (−) of BMP1. The numbers beneath lanes indicate signal intensity relative to signal in control lane (B and D). The numbers to the left of blots correspond to the positions and approximate sizes in kD of molecular mass markers or known protein bands. In some cases, the molecular masses of known proteins are noted parenthetically next to the name of the protein.
Figure 4.
Figure 4.
Comparison of fibrillar LTBP1 deposition, TGFβ activity, and MMP levels in Bmp1/Tll1 doubly null and wild-type MEF cultures. (A) Wild-type (WT) and Bmp1/Tll1 doubly null MEF cell layers were subjected to immunofluorescence staining, using polyclonal anti-LTBP1 or anti–fibrillin 1 (FBN1) antibodies. Images were deconvoluted and contrast was adjusted with the same parameters. Photomicrograph exposure times were identical per given antibody (1/8 and 1/15 s for anti-LTBP1 and anti–fibrillin 1, respectively) to ensure comparability of signal levels for wild-type and mutant tissues. Bar, 20 μm. (B–D) Bmp1/Tll1 doubly null MEF culture media contain similar levels of TGFβ but markedly lower levels of active TGFβ than wild-type culture media. Conditioned media from Bmp1/Tll1 doubly null and wild-type MEFs were separately added to a reporter gene assay without (B) or with (C) heat activation, for detection of active or total TGFβ, respectively. Aliquots of 2.5, 5, 10, 20, and 50 μl were added, as indicated. (D) In a control experiment, conditioned media from Bmp1/Tll1 doubly null and wild-type MEFs were incubated 1 h at 4°C in the absence (−) or presence of either anti-TGFβ1 (αTGFβ1) or pan-specific (α pan TGFβ) anti-TGFβ antibody before addition to the reporter gene assay. (E) MEFs were cocultured with T-MLEC reporter cells, followed by scraping of cell layers for determination of luciferase levels. (B–E) Numbers on the ordinate axis represent fold increases in levels of luciferase activity. (F–H) Levels of TGFβ-induced MMPs and CYR61 are notably higher in wild-type than in Bmp1/Tll1 doubly null MEF cultures. (F) 25, 30, and 35 cycles of RT-PCR were performed on RNA from wild-type and Bmp1/Tll1 doubly null MEFs. Sizes of cDNA bands in bp are noted in brackets to the right of the panel. (G and H) Western blot analyses were performed on media (G) and cell layers (H) of wild-type or Bmp1/Tll1 doubly null MEFs using antibodies to MMP2 (Chemicon), MMP9 (Abcam), CYR61 (Santa Cruz Biotechnology, Inc.), and p-Smad2/3, and against PCOLCE1 (G; Lee et al., 1997) and tubulin (H; Oncogene) as loading controls. Molecular masses of known proteins are noted parenthetically next to the name of the protein.
Figure 5.
Figure 5.
Increased LTBP1 accumulation and decreased TGFβ signaling are found in Bmp1/Tll1 doubly null tissues and accompany developmental failure of the frontal bone in Bmp1−/−/Tll1+/− embryos. (A) Bmp1/Tll1 doubly null tissues show decreased TGFβ signaling and increased LTBP1 accumulation compared with wild type (WT). Serial parasagittal sections of tissues of 13.5-dpc wild-type and Bmp1/Tll1 doubly null embryos were subjected to hematoxylin/eosin (H&E) staining (top) and immunofluorescent staining with polyclonal antibodies to LTBP1, phosphorylated Smad2/3, and fibrillin 1 (FBN1). Shown are cross sections of presumptive rib. (B) Increased LTBP1 accumulation and decreased TGFβ signaling accompany developmental failure of the frontal bone in Bmp1 −/−/Tll1 +/− embryos. Serial coronal sections of 17.5-dpc wild-type and Bmp1 −/−/Tll1 +/− embryos were subjected to hematoxylin/eosin staining (top) or immunofluorescent staining. Arrowheads mark the boundaries of ossified and nonossified mesenchymal portions of presumptive frontal bones. Insets in the top panels of B correspond to the hematoxylin/eosin-stained sections immediately below. Note that although both margins of ossified frontal bone are visible near the midline in wild type (B), only a single Bmp1 −/−/Tll1 +/− margin is shown because of the wide gap separating the two margins in retarded mutant frontal bone. For immunofluorescence, photomicrograph exposure times were identical per given antibody (1/8, 1/4, and 1/30 s for anti-LTBP1, anti–p-Smad2/3, and anti-FBN1, respectively) to ensure comparability of signal levels for wild-type and mutant tissues. Bars: (B, top) 80 μm; (A and B) 20 μm.
Figure 6.
Figure 6.
Manifold roles for BMP1-like proteinases and the BMP1/TGFβ feed-forward loop for tissue remodeling. BMP1-like proteinases biosynthetically process ECM precursors (e.g., procollagen) to mature functional ECM components. They also activate TGFβ by processing LTBP1 to release truncated LLC from ECM, leading to consequent activation via LAP cleavage by metalloproteinases such as MMP2. Activated TGFβ induces activation of R-Smad2 and -3, which combine with Smad4 for translocation to the nucleus and up-regulation (vertical arrows) of BMP1, ECM precursors (e.g., procollagen), MMP2, and TGFβ itself. TGFβ also down-regulates some MMPs that degrade ECM (e.g., MMP1). BMP1-like proteinases also activate BMP2/4 by cleaving the antagonist Chordin, thus inducing activation of R-Smad1, -5, and -8. The latter may compete with R-Smad2 and -3 for limiting amounts of Smad4. Conceivably, Chordin competes with ECM precursors and LTBP1 for BMP1-like proteinases. Thus, Smad4 and BMP1-like proteinases may represent two levels at which cross talk between TGFβ and BMP signaling pathways orchestrates tissue remodeling with patterning.

Similar articles

Cited by

References

    1. Abe, M., J.G. Harpel, C.N. Metz, I. Nunes, D.J. Loskutoff, and D.B. Rifkin. 1994. An assay for transforming growth factor-β using cells transfected with a plasminogen activator inhibitor-1 promoter-luciferase construct. Anal. Biochem. 216:276–284. - PubMed
    1. Annes, J.P., J.S. Munger, and D.B. Rifkin. 2003. Making sense of latent TGF β activation. J. Cell Sci. 116:217–224. - PubMed
    1. Bertolino, P., M. Deckers, F. Lebrin, and P. ten Dijke. 2005. Transforming growth factor-β signal transduction in angiogenesis and vascular disorders. Chest. 128:585S–590S. - PubMed
    1. Blader, P., S. Rastegar, N. Fischer, and U. Strahle. 1997. Cleavage of the BMP-4 antagonist chordin by zebrafish tolloid. Science. 278:1937–1940. - PubMed
    1. Border, W.A., and E. Ruoslahti. 1992. Transforming growth factor-β in disease: the dark side of tissue repair. J. Clin. Invest. 90:1–7. - PMC - PubMed

Publication types

MeSH terms