. 2006 Oct;116(10):2817-26.
doi: 10.1172/JCI25673.

VSIG4, a B7 family-related protein, is a negative regulator of T cell activation

Affiliations

VSIG4, a B7 family-related protein, is a negative regulator of T cell activation

Lorenz Vogt et al. J Clin Invest. 2006 Oct.

Abstract

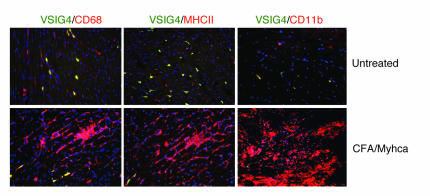
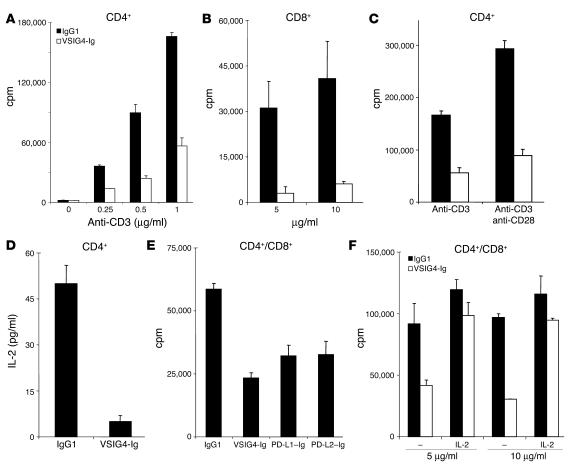
T cell activation by APCs is positively and negatively regulated by members of the B7 family. We have identified a previously unknown function for B7 family-related protein V-set and Ig domain-containing 4 (VSIG4). In vitro experiments using VSIG4-Ig fusion molecules showed that VSIG4 is a strong negative regulator of murine and human T cell proliferation and IL-2 production. Administration to mice of soluble VSIG4-Ig fusion molecules reduced the induction of T cell responses in vivo and inhibited the production of Th cell-dependent IgG responses. Unlike that of B7 family members, surface expression of VSIG4 was restricted to resting tissue macrophages and absent upon activation by LPS or in autoimmune inflammatory foci. The specific expression of VSIG4 on resting macrophages in tissue suggests that this inhibitory ligand may be important for the maintenance of T cell unresponsiveness in healthy tissues.


Figures

Figure 1
Figure 1. Sequence and homology of VSIG4.
(A) Amino acid sequence alignment of murine VSIG4 with the putative human ortholog Z39Ig. The N-terminal signal sequences determined according to von Heijne (53) are underlined. The 2 Ig domains are in italics, and identical amino acids are indicated with dots. The gaps are indicated with dashes. Bold letters correspond to the predicted transmembrane domain. Overall, the 2 proteins show 44% identity, and within the common extracellular domain (aa 1–139), 78% identity was found between VSIG4 and Z39Ig. (B) Percentage of identity between the extracellular domains of known B7 superfamily members.
Figure 2
Figure 2. VSIG4 is expressed on resting peritoneal macrophages and downregulated upon activation.
(A) VSIG4 copies normalized to GAPDH in the respective tissues or cell types are shown. Sm muscle, smooth muscle. (B) Characterization of anti-VSIG4 rabbit serum. Left: EL4 (filled histogram) or EL4-VSIG4 cells (black lines) were stained with anti-VSIG4. Right: Western blot analysis of lysates from 293 and 293-VSIG4 cells with anti-VSIG4. (C) Peritoneal macrophages (Mϕ), monocytes, and neutrophils from blood and spleen and activated and naive DCs were stained with anti-VSIG4 (black lines) and preimmune serum (filled histograms). Gating markers are indicated above the histograms. Half of the CD11b+/Gr1 cells from the peritoneum (resident macrophages) showed VSIG4 expression. (D) Resting peritoneal macrophages and macrophages activated in vivo by thioglycolate (Thio) or LPS for 3 days were isolated, stained for the expression of VSIG4, and analyzed by FACS as described for C. Histograms of the gated CD11b+/Gr1 cell population are shown. (E) Resting peritoneal macrophages and macrophages activated in vivo by thioglycolate and PBMCs from the same animals were isolated and analyzed for VSIG4 expression by Western blotting using polyclonal anti-VSIG4 antibodies. PerC, peritoneal cells. (F) Dot plots of cells isolated from the peritoneum and stained with the indicated cell-surface marker and VSIG4 rabbit serum. (G) Freshly isolated peritoneal macrophages were either stained directly or cultivated in the presence or absence of 10 μg/ml LPS for 3 days and stained with anti-VSIG4 (black lines) or preimmune serum (filled histogram). Histograms of the gated CD11b+/Gr1low cell population are shown. Representative stainings of at least 2 independent experiments are shown.
Figure 3
Figure 3. VSIG4 is expressed on resting tissue macrophages.
Organs of untreated mice were assessed for VSIG4 expression by histology. (A and E) Kupffer cells lining the sinusoids of the liver were evenly positive for VSIG4. (B and F) Occasional macrophages of the red pulp of the spleen were positive, while macrophages of the white pulp were negative for VSIG4 (B). Within the red pulp (F), iron-laden macrophages (a weak granular signal was derived from the iron) were negative (small arrow), while other macrophages were weakly positive for VSIG4 (large arrowheads). (C and G) The myocardium showed an uneven distribution of VSIG4-positive macrophages. VSIG4 was also detected in tissue-resident macrophages of adipose tissue (D). VSIG4 was absent in thymic cortex and detected in rare macrophages of the thymic medulla (H). Representative stainings of at least 2 independent experiments are shown. Original magnification, ×60 (AD); ×150 (EH).
Figure 4
Figure 4. Macrophages in autoimmune infiltrates of the heart do not express VSIG4.
Myocarditis was induced by immunization with α–myosin heavy chain–derived peptide in CFA (CFA/Myhca), and as a control, untreated mice were used. Heart sections from inflamed hearts and control hearts were stained with VSIG4 (green) together with CD68, MHC class II (MHC II), or CD11b (red) as indicated. In untreated mice, a fraction of CD68- or CD11b-positive tissue-resident macrophages coexpressed VSIG4. (Note that all VSIG4-positive cells coexpressed Cd11b; in some cases, Cd11b expression was low, precluding visualization of the expression in an overlay image). In contrast, MHC class II–positive DCs showed no coexpression of VSIG4. In CFA/Myhca-immunized mice, inflammatory foci included numerous CD68-positive macrophages that showed no coexpression of VSIG4. Occasional VSIG4-positive macrophages were detected in the myocardium surrounding the inflammatory focus. On a consecutive histological section, abundant MHC class II expression was detected within the inflammatory infiltrate, probably mostly on activated macrophages. Representative stainings of at least 2 independent experiments are shown. Original magnification, ×150.
Figure 5
Figure 5. VSIG4 inhibits T cell proliferation and IL-2 production in vitro.
(A) Plates were coated with anti-CD3 at the indicated concentrations in the presence of 5 μg/ml VSIG4-Ig or control IgG1. Proliferation of purified CD4+ T cells was monitored after 2 days by [3H]thymidine incorporation. (B) Plates were coated with anti-CD3 at 0.5 μg/ml in the presence of 5 or 10 μg/ml VSIG4-Ig or IgG1 at the indicated concentrations. CD8+ T cell proliferation was monitored after 2 days by [3H]thymidine incorporation. (C) Costimulation assays were performed with purified CD4+ T cells with a fixed concentration of anti-CD3 (0.5 μg/ml) in the presence or absence of anti-CD28 (2 μg/ml) with either 5 μg/ml VSIG4-Ig or control IgG1. (D) IL-2 production of CD4+ T cells stimulated with 0.5 μg/ml anti-CD3 in the presence of 5 μg/ml VSIG4-Ig or control IgG1. (E) Proliferation assays were performed in the presence of 0.5 μg/ml anti-CD3 and VSIG4-Ig, PD-L1–Ig, PD-L2–Ig, or control IgG1 at a concentration of 10 μg/ml. (F) Proliferation assays were performed in the presence of 0.5 μg/ml anti-CD3 and VSIG4-Ig or control IgG1 at a concentration of 5 or 10 μg/ml in the absence or presence of 10 ng/ml IL-2. Error bars represent standard deviations for data from experiments performed in triplicate. Representative data from least 2 independent experiments are shown. The difference between VSIG4-Ig– and IgG1-treated cells was significant in all panels shown (P < 0.05). In F, the difference between VSIG4-Ig– and IgG1-treated cells in the presence of IL-2 was not significant (P > 0.05).
Figure 6
Figure 6. Z39Ig, the human homolog of VSIG4, inhibits T cell proliferation.
(A) Proliferation assays were performed with purified mouse CD4+ T cells with 0.5 μg/ml anti-CD3 in the presence or absence of 2 μg/ml anti-CD28 with Z39Ig-Ig (human VSIG4) or control IgG1 at a concentration of 5 μg/ml. (B) Proliferation assays were performed with CD4+ T cells purified from human PBMCs in the presence of the indicated amounts of anti-CD3 together with Z39Ig-Ig (human VSIG4) or control IgG1 at a concentration of 20 μg/ml. Error bars represent standard deviations for data from experiments performed in triplicate. Representative data from at least 2 independent similar experiments are shown. The differences between Z39Ig-Ig– treated cells compared with control IgG1–treated cells were significant (P < 0.05) in both A and B.
Figure 7
Figure 7. Soluble VSIG4 inhibits induction of CTL responses and Th cell–dependent humoral immune responses in vivo.
(A) Experimental diagram. Mice were injected with VSIG4-Ig or control IgG i.p. on days –1, 1, and 3 and immunized with Qβ-p33 VLPs with CpGs on day 0. Qβ-specific IgM and IgG responses were measured after 4 and 10 days. p33-specific CD8+ T cells were determined in the blood by tetramer staining on day 7. Mice were sacrificed on day 10, and levels of Qβ-specific B cells, AFCs, and p33-specific IFN-γ–expressing CD8+ T cells were determined from spleens. (BG) Averages of 2 independent experiments ± SEM are shown (n = 8). Differences between VSIG4-Ig– and IgG1-treated mice were significant in B, C, and the right panel of D, as well as F and G. P values obtained by Student’s t test are shown. (B) Percentage p33-specific CD8+ T cells. (C) Percentage p33-specific CD8+ T cells after in vitro stimulation with p33-pulsed DCs 10 days after immunization. (D) ELISA titers of the Qβ-specific IgM and IgG responses. (E) Staining and gating strategy for the detection of isotype-switched B cells by FACS. Activated, isotype-switched B cells were found in the indicated gate. A representative example of Qβ-binding B cells in the indicated gate is shown in the right panel. (F) Percentage of Qβ-specific B cells within the indicated gate in E in mice 10 days after immunization. (G) Number of Qβ-specific AFCs per 106 splenocytes as determined by ELISPOT are shown.

Comment in

  • To be or not to be B7.
    Zang X, Allison JP. Zang X, et al. J Clin Invest. 2006 Oct;116(10):2590-3. doi: 10.1172/JCI30103. J Clin Invest. 2006. PMID: 17016555 Free PMC article.

References

    1. Langman R.E., Cohn M. Two signal models of lymphocyte activation? Immunol. Today. 1993;14:235–237. - PubMed
    1. Lenschow D.J., Walunas T.L., Bluestone J.A. CD28/B7 system of T cell costimulation. Annu. Rev. Immunol. 1996;14:233–258. - PubMed
    1. Chambers C.A., Allison J.P. Costimulatory regulation of T cell function. Curr. Opin. Cell Biol. 1999;11:203–210. - PubMed
    1. Schwartz R.H. T cell anergy. Annu. Rev. Immunol. 2003;21:305–334. - PubMed
    1. Sharpe A.H., Freeman G.J. The B7-CD28 superfamily. Nat. Rev. Immunol. 2002;2:116–126. - PubMed

MeSH terms

Associated data