Comparative Study
. 2006 Oct 3:7:66.
doi: 10.1186/1471-2202-7-66.

Progressive ganglion cell loss and optic nerve degeneration in DBA/2J mice is variable and asymmetric

Affiliations
Comparative Study

Progressive ganglion cell loss and optic nerve degeneration in DBA/2J mice is variable and asymmetric

Cassandra L Schlamp et al. BMC Neurosci. .

Abstract

Background: Glaucoma is a chronic neurodegenerative disease of the retina, characterized by the degeneration of axons in the optic nerve and retinal ganglion cell apoptosis. DBA/2J inbred mice develop chronic hereditary glaucoma and are an important model system to study the molecular mechanisms underlying this disease and novel therapeutic interventions designed to attenuate the loss of retinal ganglion cells. Although the genetics of this disease in these mice are well characterized, the etiology of its progression, particularly with respect to retinal degeneration, is not. We have used two separate labeling techniques, post-mortem DiI labeling of axons and ganglion cell-specific expression of the betaGeo reporter gene, to evaluate the time course of optic nerve degeneration and ganglion cell loss, respectively, in aging mice.

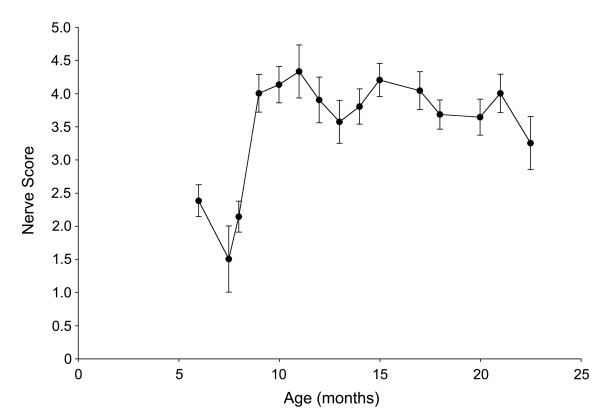
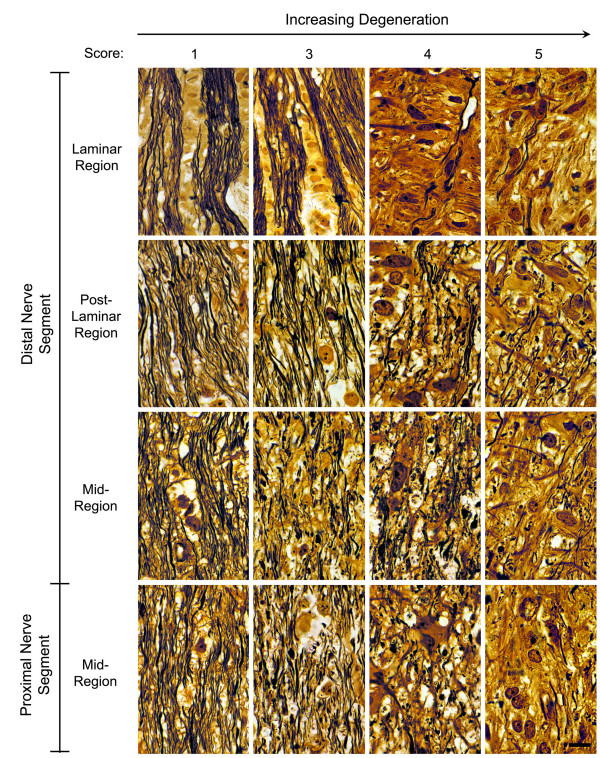
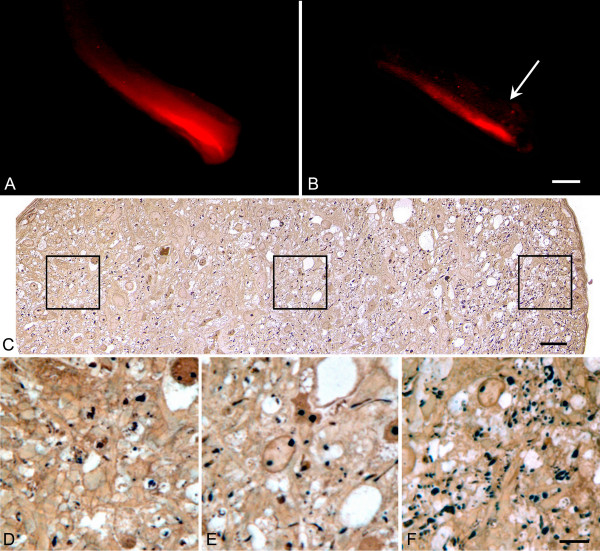
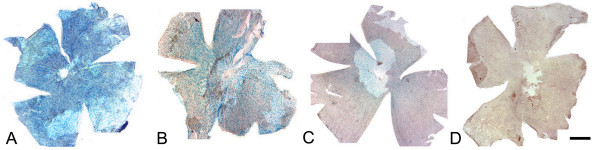
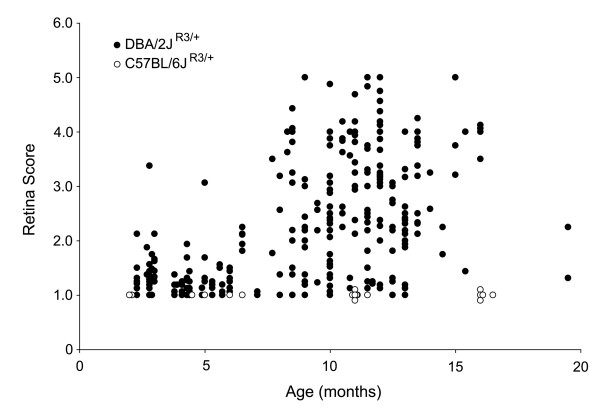
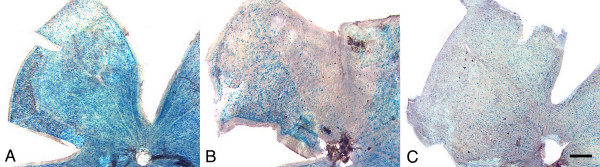
Results: Optic nerve degeneration, characterized by axon loss and gliosis is first apparent in mice between 8 and 9 months of age. Degeneration appears to follow a retrograde course with axons dying from their proximal ends toward the globe. Although nerve damage is typically bilateral, the progression of disease is asymmetric between the eyes of individual mice. Some nerves also exhibit focal preservation of tracts of axons generally in the nasal peripheral region. Ganglion cell loss, as a function of the loss of betaGeo expression, is evident in some mice between 8 and 10 months of age and is prevalent in the majority of mice older than 10.5 months. Most eyes display a uniform loss of ganglion cells throughout the retina, but many younger mice exhibit focal loss of cells in sectors extending from the optic nerve head to the retinal periphery. Similar to what we observe in the optic nerves, ganglion cell loss is often asymmetric between the eyes of the same animal.

Conclusion: A comparison of the data collected from the two cohorts of mice used for this study suggests that the initial site of damage in this disease is to the axons in the optic nerve, followed by the subsequent death of the ganglion cell soma.


Figures

Figure 1
Figure 1
Photomicrographs of the optic nerves of 3 mice labeled post-mortem with DiI. The images shown are dorsal views, looking down on the mouse head with the nose of the mouse facing the bottom of the image. The right nerve is on the left of each photomicrograph. (A) A young mouse (6 months of age) showing both optic nerves labeled from the globes to the optic chiasm. (B) An old mouse (10 months of age) showing relatively symmetric degeneration of both nerves. Degenerating nerves typically exhibit reduced label distally. (C) A second mouse at 10 months of age, showing asymmetric degeneration of it optic nerves. Only the left nerve is labeled. Bar = 0.5 mm.
Figure 2
Figure 2
Graph of the mean (± SEM) severity score for individual optic nerves of mice as a function of age. This cohort of DBA/2J mice showed a steep increase in the prevalence of optic nerve degeneration at 9 months of age.
Figure 3
Figure 3
Degeneration of axons occurs first in regions of the optic nerve proximal to the laminar region. A series of 16 photomicrographs are shown of 4 different optic nerves in different stages of degeneration based on the DiI-labeling pattern. The distal and proximal segments of each nerve were sectioned longitudinally and silver stained. The individual nerves are oriented from left to right, with their respective score shown at the top. Photomicrographs taken from each nerve are oriented from the laminar region (top panels) through to a region in the middle of the proximal segment (bottom panels). A normal nerve (left panels – score of 1) contains bundles of axons flanking columns of cells in the laminar region. Immediately posterior to this region, the axons separate from the bundles and anastomose along the entire length of the nerve. A nerve with moderate degeneration (panels second from the left – score of 3) also contains relatively normal appearing bundles of axons in the lamina. Small regions of degenerating axons are found along nerve posterior to the lamina, especially in the mid-region of the distal segment and the proximal segment. These regions are exemplified by swollen axons and axon fragments. Nerves with severe degeneration (panels third and fourth from the left) show much more extensive axonal degeneration and loss, gliosis, and scar tissue deposition. Bar = 15 μm.
Figure 4
Figure 4
Nerves with severe degeneration often show preservation of nasal tracts of axons. (A, B) DiI-labeled optic nerves showing nasal tracts of staining. The left nerve only is shown for each mouse. The nerve in panel B is almost completely degenerated. The edge of the nerve sheath on the temporal side is marked with an arrow. Bar = 0.6 mm. (C) Silver-stained cross section of a nerve showing a peripheral tract of DiI-staining. This low resolution montage was made up of a series of photomicrographs taken at 1000X. The nasal part of the nerve is oriented to the right. Bar = 15 μm. (D-F) Higher resolution images of the respective boxed region in (C) shown above each panel. (D) Temporal optic nerve. (E) Central optic nerve. (F) Nasal optic nerve. The nasal region of this nerve contains a higher density of axons, consistent with the DiI-labeling pattern. Bar in (F) = 4 μm.
Figure 5
Figure 5
Whole mounts of retinas taken from 13 month old DBA/2JR3/+ mice show variable levels of degeneration. Retinas were stained for βGEO activity in the presence of X-Gal. Each retina is taken from a different animal. This series of photomicrographs demonstrates the high degree of variability observed in disease progression in the DBA/2J line, where some animals have virtually no evidence of ganglion cell loss (A), while others have nearly complete cell loss (D). The retinas shown also demonstrate the scoring system used to quantify the βGeo staining patterns observed: (A) represents a score of approximately 1, (B) a score of approximately 2, (C) a score of approximately 3, and (D) a score of approximately 4. Retinas given a score of 5 exhibited no positively staining cells. Bar = 1 mm.
Figure 6
Figure 6
Scatter plot of X-Gal staining scores for individual retinas from aged DBA/2J R3/+ mice compared to aged C57BL/6R3/+ animals. Loss of X-Gal staining correlates to the loss of retinal ganglion cells [27]. A majority of DBA/2J mice older than 10.5 months exhibit reduced staining, relative to younger animals (closed circles). Although these mice develop progressively more damage as they age, there is a high degree of variability in the amount of damage exhibited by mice at the older ages. Retinal disease is associated with the DBA/2J genetic background, since no cell loss was observed in C57BL/6 mice (open circles) at any age examined.
Figure 7
Figure 7
βGeo staining pattern of DBA/2JR3/+ mice showing distinct patterns of ganglion cell loss. (A) A retinal lobe of a young mouse showing normal staining for βGeo activity. (B) A retinal lobe from an older mouse (9 months), showing regional loss of ganglion cells in a sector of retina with adjacent regions of normal retina. (C) A retinal lobe from an old mouse (11.5 months) showing diffuse loss of ganglion cells generally uniformly across the retina. In this cohort of mice, the pattern of cell loss seen in the example in (B) was exhibited principally in middle-aged mice (8–9 months), with early signs of degeneration. Bar = 0.5 mm.
Figure 8
Figure 8
Retinas and optic nerves show consistent patterns of degeneration. A series of retinas and corresponding optic nerves from 4 different mouse eyes. The retinas were stained for βGEO enzyme activity and the optic nerves were sectioned just posterior to the laminar region and silver-stained. (A, B) A retina with extensive staining has a nerve with normal appearing nerve with well-defined bundles of axons. (C, D) A retina with two wedge-shaped regions of cell loss (asterisks) has a nerve with two similar focal areas of axon loss (asterisks). (E, F) A retina with a large region of cell loss (asterisk) in one half and uniform cell loss in the other has a nerve with a large contiguous region devoid of axons (asterisks), while the remainder of the nerve has a uniform depletion of axons. (G, H) A retina with nearly complete cell loss has a nerve with nearly complete axon loss. Each retina is oriented with the superior region to the top. Each optic nerve is oriented with the dorsal nerve to the top. The central retinal artery (A) and vein (V) are indicated. Bar = 0.45 mm (panels A, C, E, G) and 90 μm (panels B, D, F, H).
Figure 9
Figure 9
Optic nerve and retina degeneration in DBA/2J mice is asymmetric. Scatter plots showing the difference in both optic nerve scores (A) or retina scores (B) for individual mice. The difference in score was calculated by subtracting the left eye (OS) score from the right eye (OD) score for each mouse. The expected result for symmetric degeneration would be a score of '0' for each animal, but clearly there is dramatic scatter of both the optic nerve and retina scores. Optic nerves also show a trend for asymmetry at an early age, consistent with the hypothesis that early damage occurs first in the nerve. Retina asymmetry is more pronounced at ages when the mice show clear signs of retinal degeneration.
Figure 10
Figure 10
Peak optic nerve damage precedes peak retinal damage in DBA/2J mice. Line graph of the mean optic nerve degeneration (closed circles) and mean retinal degeneration (open circles) as a function of age in two cohorts of DBA/2J mice. In this comparative analysis, DBA/2J mice exhibited optic nerve disease before they exhibited retinal disease, consistent with theories of human glaucoma that predict that the initial damage in response to ocular hypertension occurs at the level of the lamina cribrosa [14, 17, 30].
Figure 11
Figure 11
Summary of the scoring criteria for DiI-labeled nerves and X-gal stained retinas. (A) Exemplar of scored optic nerves. Only the left nerve is shown for 5 individual mice. The scores range from 1 for label from the globe to the chiasm, to 5 for no signs of label. Younger mice typically exhibited nerves that were scored 1–2, while older mice typically had nerves showing some level of degeneration (3–5). Bar = 0.5 mm. (B) A photomicrograph of a retina (OD) stained for βGEO activity taken from a 10.5 month old mouse. This particular example appears to have 2 wedges of cell loss, one superior and one temporal, at different stages of degeneration. (C) A cartoon of a flatmounted retina where each quadrant is separated into 4 regions and given a score based on the intensity of stain present. The quadrants represented are (clockwise): SN, superonasal; IN, inferonasal; IT, inferotemporal; ST, superotemporal. The scores in each region of the quadrants represent the scores given by 1 masked observer for the retina in (B). The average of all the scores in each quandrant then becomes the total score for that quadrant, and the average of these 4 scores becomes the final total score for that retina.

Similar articles

Cited by

References

    1. John SWM, Smith RS, Savinova OV, Hawes NL, Chang B, Turnbull D, Davisson M, Roderick TH, Heckenlively JR. Essential iris atrophy, pigment dispersion, and glaucoma in DBA/2J mice. Invest Ophthalmol Vis Sci. 1998;39:951–962. - PubMed
    1. Anderson MG, Smith RS, Hawes NL, Zabaleta A, Chang B, Wiggs JL, John SWM. Mutations in genes encoding melanosomal proteins cause pigmentary glaucoma in DBA/2J mice. Nat Genet. 2002;30:81–85. doi: 10.1038/ng794. - DOI - PubMed
    1. Chang B, Smith RS, Hawes NL, Anderson MG, Zabaleta A, Savinova O, Roderick TH, Heckenlively JR, Davisson MT, John SWM. Interacting loci cause severe iris atrophy and glaucoma in DBA/2J mice. Nature Genet. 1999;21:405–409. doi: 10.1038/7741. - DOI - PubMed
    1. Mo JS, Anderson MG, Gregory M, Smith RS, Savinova OV, Sereze DV, Ksander BR, Streilein JW, John SWM. By altering ocular immune privilege, bone marrow-derived cells pathogenetically contribute to DBA/2J pigmentary glaucoma. J Exp Med. 2003;197:1335–1344. doi: 10.1084/jem.20022041. - DOI - PMC - PubMed
    1. Libby RT, Anderson MG, Pang IH, Robinson Z, Savinova OV, Cosma IM, Snow A, Wilson LA, Smith RS, Clark AF, John SWM. Inherited glaucoma in DBA/2J mice: pertinent disease features for studying the neurodegeneration. Vis Neurosci. 2005;22:637–648. - PubMed

Publication types

MeSH terms