

Transformations of mathematical and stimulus functions
- PMID: 17020211
- PMCID: PMC1702403
- DOI: 10.1901/jaba.2006.139-05
Transformations of mathematical and stimulus functions
Abstract
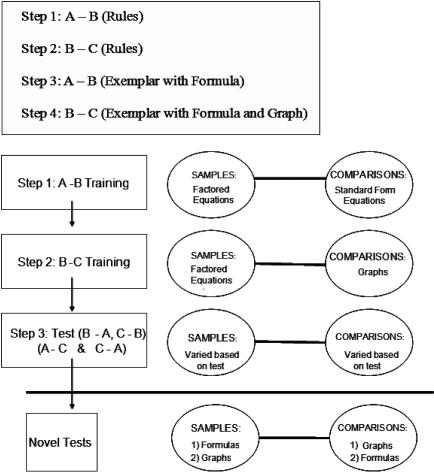
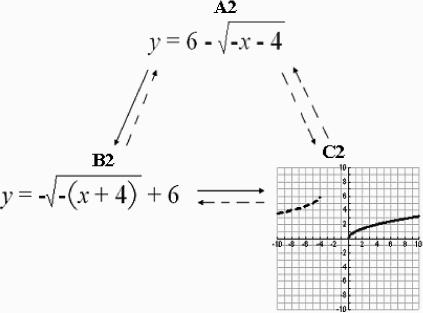
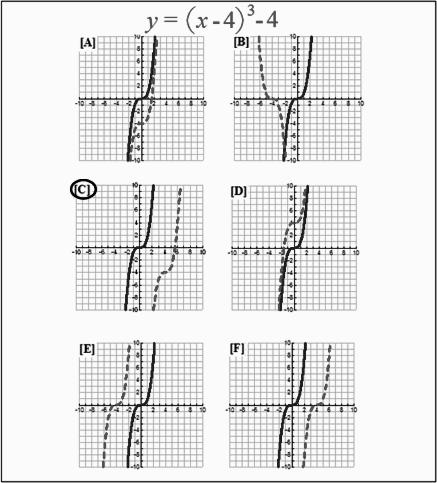
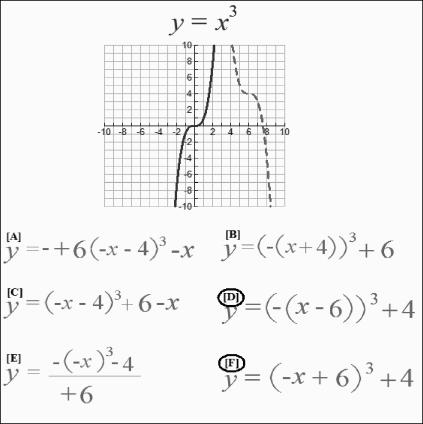
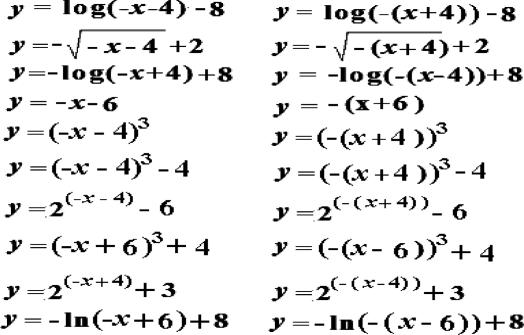
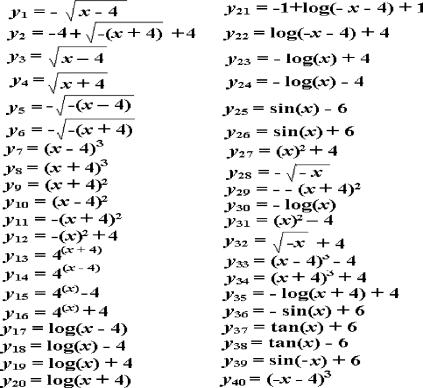
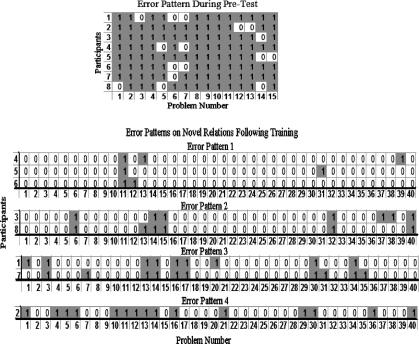
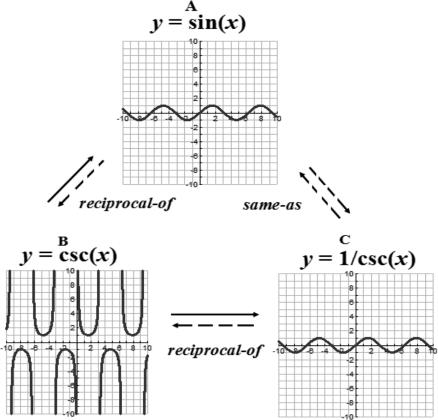
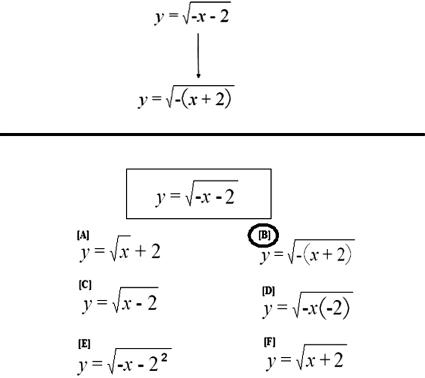
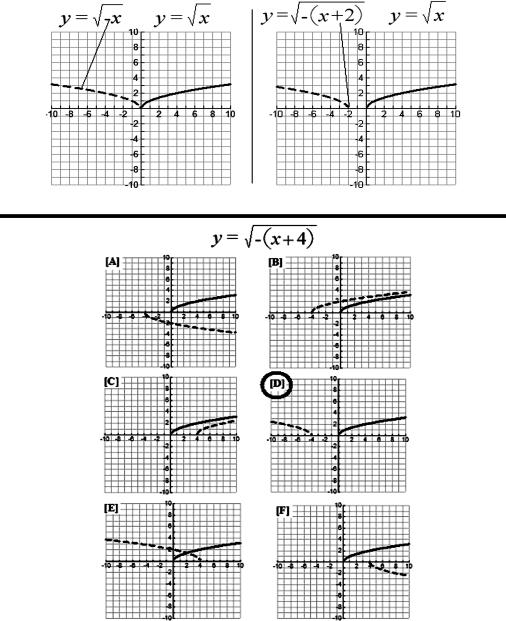
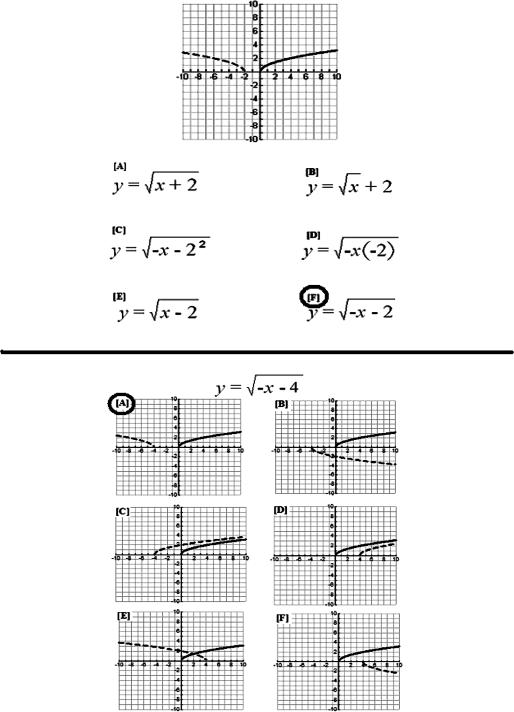
Following a pretest, 8 participants who were unfamiliar with algebraic and trigonometric functions received a brief presentation on the rectangular coordinate system. Next, they participated in a computer-interactive matching-to-sample procedure that trained formula-to-formula and formula-to-graph relations. Then, they were exposed to 40 novel formula-to-graph tests and 10 novel graph-to-formula tests. Seven of the 8 participants showed substantial improvement in identifying formula-to-graph relations; however, in the test of novel graph-to-formula relations, participants tended to select equations in their factored form. Next, we manipulated contextual cues in the form of rules regarding mathematical preferences. First, we informed participants that standard forms of equations were preferred over factored forms. In a subsequent test of 10 additional novel graph-to-formula relations, participants shifted their selections to favor equations in their standard form. This preference reversed during 10 more tests when financial reward was made contingent on correct identification of formulas in factored form. Formula preferences and transformation of novel mathematical and stimulus functions are discussed.
Figures

Similar articles
-
A functional analytic approach to computer-interactive mathematics.J Appl Behav Anal. 2005 Spring;38(1):1-22. doi: 10.1901/jaba.2005.2-04. J Appl Behav Anal. 2005. PMID: 15898471 Free PMC article. Clinical Trial.
-
Constructing and deriving reciprocal trigonometric relations: a functional analytic approach.J Appl Behav Anal. 2009 Summer;42(2):191-208. doi: 10.1901/jaba.2009.42-191. J Appl Behav Anal. 2009. PMID: 19949509 Free PMC article.
-
The Psychophysics of Algebra Expertise: Mathematics Perceptual Learning Interventions Produce Durable Encoding Changes.Cogsci. 2014 Jul;36:272-277. Cogsci. 2014. PMID: 30116797 Free PMC article.
-
Computational tools for the modern andrologist.J Androl. 1996 Sep-Oct;17(5):462-6. J Androl. 1996. PMID: 8957688 Review.
-
Applications of graph theory to enzyme kinetics and protein folding kinetics. Steady and non-steady-state systems.Biophys Chem. 1990 Jan;35(1):1-24. doi: 10.1016/0301-4622(90)80056-d. Biophys Chem. 1990. PMID: 2183882 Review.
Cited by
-
Toward a technology of derived stimulus relations: an analysis of articles published in the journal of applied behavior analysis, 1992-2009.J Appl Behav Anal. 2011 Spring;44(1):109-19. doi: 10.1901/jaba.2011.44-109. J Appl Behav Anal. 2011. PMID: 21541138 Free PMC article. Review.
-
Using the stimulus equivalence paradigm to teach course material in an undergraduate rehabilitation course.J Appl Behav Anal. 2010 Winter;43(4):615-33. doi: 10.1901/jaba.2010.43-615. J Appl Behav Anal. 2010. PMID: 21541148 Free PMC article.
-
Learning Skinner's Verbal Operants: Comparing an Online Stimulus Equivalence Procedure to an Assigned Reading.Anal Verbal Behav. 2015 Jul 14;31(2):255-66. doi: 10.1007/s40616-015-0035-1. eCollection 2015 Oct. Anal Verbal Behav. 2015. PMID: 27606215 Free PMC article.
-
Using equivalence-based instruction to increase efficiency in teaching neuroanatomy.J Undergrad Neurosci Educ. 2012 Spring;10(2):A125-31. Epub 2012 Mar 15. J Undergrad Neurosci Educ. 2012. PMID: 23504446 Free PMC article.
-
Comparison of a stimulus equivalence protocol and traditional lecture for teaching single-subject designs.J Appl Behav Anal. 2011 Winter;44(4):819-33. doi: 10.1901/jaba.2011.44-819. J Appl Behav Anal. 2011. PMID: 22219532 Free PMC article.
References
-
- Barnes-Holmes D, O'Hora D, Roche R, Hayes S.C, Bissett R.T, Lyddy F. Understanding and verbal regulations. In: Hayes S.C, Barnes-Holmes D, Roche B, editors. Relational frame theory: A post-Skinnerian account of human language and cognition. New York: Kluwer Academic/Plenum; 2001. pp. 103–117. In. eds.
-
- Barnes-Holmes Y, Barnes-Holmes D, Roche B, Smeets P. Exemplar training and a derived transformation of function in accordance with symmetry. The Psychological Record. 2001;51:589–604.
-
- Barnes-Holmes Y, Barnes-Holmes D, Smeets P.M, Strand P, Friman P. Establishing relational responding in accordance with more-than and less-than as a generalized operant behavior in young children. International Journal of Psychology and Psychological Theory. 2004;4:531–558.
-
- Biggs J, Moore P. The process of learning. Sydney: Prentice Hall; 1993.
MeSH terms
LinkOut - more resources
Full Text Sources
