. 2006;34(19):e130.
doi: 10.1093/nar/gkl707. Epub 2006 Oct 4.

Analysis of protein sequence and interaction data for candidate disease gene prediction

Affiliations

Analysis of protein sequence and interaction data for candidate disease gene prediction

Richard A George et al. Nucleic Acids Res. 2006.

Abstract

Linkage analysis is a successful procedure to associate diseases with specific genomic regions. These regions are often large, containing hundreds of genes, which make experimental methods employed to identify the disease gene arduous and expensive. We present two methods to prioritize candidates for further experimental study: Common Pathway Scanning (CPS) and Common Module Profiling (CMP). CPS is based on the assumption that common phenotypes are associated with dysfunction in proteins that participate in the same complex or pathway. CPS applies network data derived from protein-protein interaction (PPI) and pathway databases to identify relationships between genes. CMP identifies likely candidates using a domain-dependent sequence similarity approach, based on the hypothesis that disruption of genes of similar function will lead to the same phenotype. Both algorithms use two forms of input data: known disease genes or multiple disease loci. When using known disease genes as input, our combined methods have a sensitivity of 0.52 and a specificity of 0.97 and reduce the candidate list by 13-fold. Using multiple loci, our methods successfully identify disease genes for all benchmark diseases with a sensitivity of 0.84 and a specificity of 0.63. Our combined approach prioritizes good candidates and will accelerate the disease gene discovery process.


Figures

Figure 1
Figure 1
Sensitivity (continuous line) and proportion of predicted genes that are actually disease genes (dashed line) for OPHID (diamond), OPHIDh (circle), OPHIDlit+ (triangle) and OPHIDlit− (square) at three levels of interactions (Distance). Results are shown for the 100 interval size only.
Figure 2
Figure 2
Performance of PPI data from (a) OPHID, (b) OPHIDh, (c) OPHIDlit+ and (d) OPHIDlit−. Results are shown for three levels of interaction using the shortest path length to a disease gene (Distance). Black diamonds represent the number of disease genes found. The number of non-disease genes returned are presented for the 50 gene interval (square), 100 gene interval (triangle) and 150 gene interval (x). The number of disease genes returned by random selection are presented for the 50 gene interval (*), 100 gene interval (circle) and 150 gene interval (+).
Figure 3
Figure 3
Combined prediction success. (a) Correct predictions based on known disease genes. (b) Correct predictions based on multiple intervals. (c) Combined CPS and CMP predictions for familial hypertrophic cardiomyopathy using known disease genes. Disease genes are represented by their HUGO-name. Gene-linking lines are predictions by CPS and CMP. For example, TNNT2 is found by the known disease gene TNNI3 using CPS-PPI and CMP predictions, and TNNI3 is found by the known disease gene TNNT2 using CPS-PPI predictions. PRKAG2 and TPM1 were found using PPI data at a distance of three, all other PPI predictions are at a distance of one.
Figure 4
Figure 4
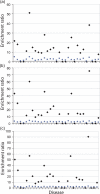
Candidate gene enrichment for the 50 (a), 100 (b) and 150 (c) gene interval sizes using the combined methods. Enrichment values are on the y-axis and diseases are listed alphabetically from left to right on the x-axis, as in Table 1. Black diamonds represent enrichment of data using known disease genes. Grey squares represent enrichment of data using multiple intervals. The dashed line represents data enrichment by random selection.

References

    1. Rudd M.F., Webb E.L., Matakidou A., Sellick G.S., Williams R.D., Bridle H., Eisen T., Houlston R.S. Variants in the GH-IGF axis confer susceptibility to lung cancer. Genome Res. 2006;16:693–701. - PMC - PubMed
    1. Smyth D.J., Cooper J.D., Bailey R., Field S., Burren O., Smink L.J., Guja C., Ionescu-Tirgoviste C., Widmer B., Dunger D.B., et al. A genome-wide association study of nonsynonymous SNPs identifies a type 1 diabetes locus in the interferon-induced helicase (IFIH1) region. Nature Genet. 2006;38:617–619. - PubMed
    1. Turner F.S., Clutterbuck D.R., Semple C.A. POCUS: mining genomic sequence annotation to predict disease genes. Genome Biol. 2003;4:R75. - PMC - PubMed
    1. Perez-Iratxeta C., Bork P., Andrade M.A. Association of genes to genetically inherited diseases using data mining. Nature Genet. 2002;31:316–319. - PubMed
    1. Perez-Iratxeta C., Wjst M., Bork P., Andrade M.A. G2D: a tool for mining genes associated with disease. BMC Genet. 2005;6:45. - PMC - PubMed

Publication types