. 2007 Mar;97(3):2525-32.
doi: 10.1152/jn.00190.2006. Epub 2006 Oct 4.

A stochastic framework for evaluating seizure prediction algorithms using hidden Markov models

Affiliations

A stochastic framework for evaluating seizure prediction algorithms using hidden Markov models

Stephen Wong et al. J Neurophysiol. 2007 Mar.

Abstract

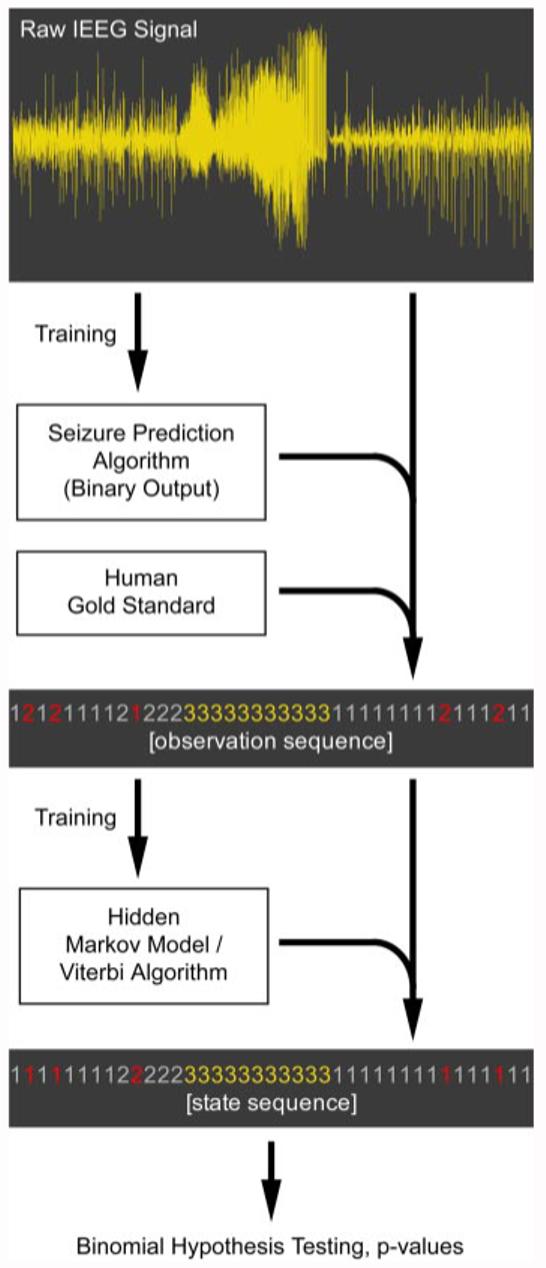
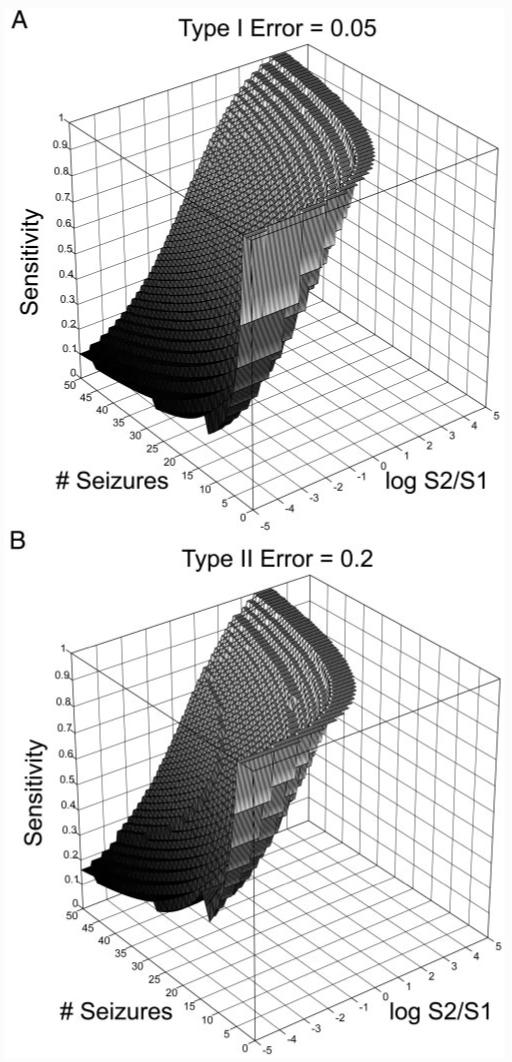
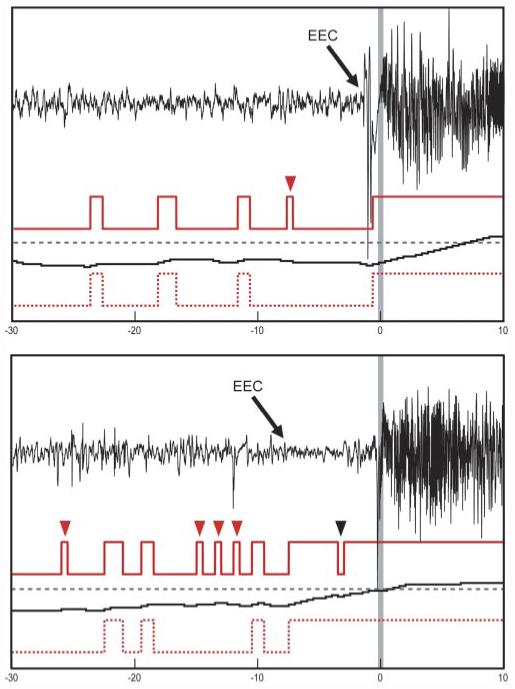
Responsive, implantable stimulation devices to treat epilepsy are now in clinical trials. New evidence suggests that these devices may be more effective when they deliver therapy before seizure onset. Despite years of effort, prospective seizure prediction, which could improve device performance, remains elusive. In large part, this is explained by lack of agreement on a statistical framework for modeling seizure generation and a method for validating algorithm performance. We present a novel stochastic framework based on a three-state hidden Markov model (HMM) (representing interictal, preictal, and seizure states) with the feature that periods of increased seizure probability can transition back to the interictal state. This notion reflects clinical experience and may enhance interpretation of published seizure prediction studies. Our model accommodates clipped EEG segments and formalizes intuitive notions regarding statistical validation. We derive equations for type I and type II errors as a function of the number of seizures, duration of interictal data, and prediction horizon length and we demonstrate the model's utility with a novel seizure detection algorithm that appeared to predicted seizure onset. We propose this framework as a vital tool for designing and validating prediction algorithms and for facilitating collaborative research in this area.


Figures

FIG. 1
FIG. 1
Diagram of the statistical validation process. Electroencephalogram (EEG) is used to train a seizure prediction algorithm. This algorithm then converts the EEG to a binary sequence (baseline and detected). Human electroencephalographer markings of seizures are then further used to create a trinary observation sequence (baseline [1], detected [2], and seizure [3]). This sequence is used to train an hidden Markov model (HMM), which is in turn used to Viterbi-decode the original observation sequence into the hidden state sequence. Illustrative noise observations are indicated in the sequences in red. Transitions into the seizure state are then counted and used in hypothesis testing to determine whether a statistical association exists between the detected and seizure states.
FIG.2
FIG.2
A: minimum sensitivity required for statistical validation (z-axis) vs. the number of seizures in the data set (y-axis) vs. log base 2 of detected state/baseline state proportions (x-axis), for type I error = 0.05. For any given number of seizures and detected to baseline state proportion, a minimum sensitivity required for statistical validation at the 0.05 error level lies above the surface. Statistical validation is difficult in regions where the detected state constitutes a large proportion of the EEG, and in regions where the number of seizures is too low. (Note that the nonsmooth boundary results from the binomial equation, a discrete function.) B: minimum sensitivity required for statistical validation (z-axis) vs. the number of seizures in the data set (y-axis) vs. log base 2 of detected state/baseline state proportions (x-axis), for type II error = 0.2, assuming the minimal sensitivity calculated in A for a type I error of 0.5.
FIG. 3
FIG. 3
Two typical seizure onsets, from different patients. Topmost red traces: raw binary support vector machine (SVM)-based seizure detection output. Middle black traces: running probability estimates determined by the particular implementation of the SVM algorithm in Gardner et al. (2006), with a dashed alarm threshold in gray. Bottom red dotted traces: HMM-Viterbi decoding of the raw binary SVM output into “state sequences.” x-axis is time in seconds, with the unequivocal electrographic onset (UEO) indicated by a gray vertical bar set to time = 0. In both examples the onset of the detected state by the HMM-Viterbi decoded method occurs seconds before the UEO, apparently within the earliest electrographic change (EEC) to UEO period, consistent with the algorithm’s original construction as an early seizure detector. The HMM-Viterbi decoded output transitioned to seizure before UEO in these 2 cases, but contained more false alarms, whereas the algorithm as implemented in Gardner et al. (2006) alarmed after UEO, but had many fewer false alarms. Raw detector’s false-positive classifications, as determined by HMM-Viterbi analysis, are indicated by red arrowheads, whereas a false negative is indicated by a black arrowhead.

Similar articles

Cited by

References

    1. Albert PS. A two-state Markov mixture model for a time-series of epileptic seizure counts. Biometrics. 1991;47:1371–1381. - PubMed
    1. Andrzejak RG, Mormann F, Kreuz T, Rieke C, Kraskov A, Elger C, Lehnertz K. Testing the null hypothesis of the nonexistence of a preseizure state. Phys Rev E. 2003;67:010901. - PubMed
    1. Andrzejak RG, Widman G, Lehnertz K, Rieke C, David P, Elger CE. The epileptic process as nonlinear deterministic dynamics in a stochastic environment: an evaluation on mesial temporal lobe epilepsy. Epilepsy Res. 2001;44:129–140. - PubMed
    1. Aschenbrenner-Scheibe R, Maiwald T, Winterhalder M, Voss HU, Timmer J, Schulze-Bonhage A. How well can epileptic seizures be predicted? An evaluation of a nonlinear method. Brain. 2003;126:2616–2626. - PubMed
    1. Dempster AP, Laird N, Rubin DB. Maximum likelihood from incomplete data via the EM algorithm. J R Stat Soc B. 1977;39:1–38.

Publication types