Comparative Study
. 2006 Oct 4;26(40):10129-40.
doi: 10.1523/JNEUROSCI.1202-06.2006.

Intraneuronal beta-amyloid aggregates, neurodegeneration, and neuron loss in transgenic mice with five familial Alzheimer's disease mutations: potential factors in amyloid plaque formation

Affiliations
Comparative Study

Intraneuronal beta-amyloid aggregates, neurodegeneration, and neuron loss in transgenic mice with five familial Alzheimer's disease mutations: potential factors in amyloid plaque formation

Holly Oakley et al. J Neurosci. .

Abstract

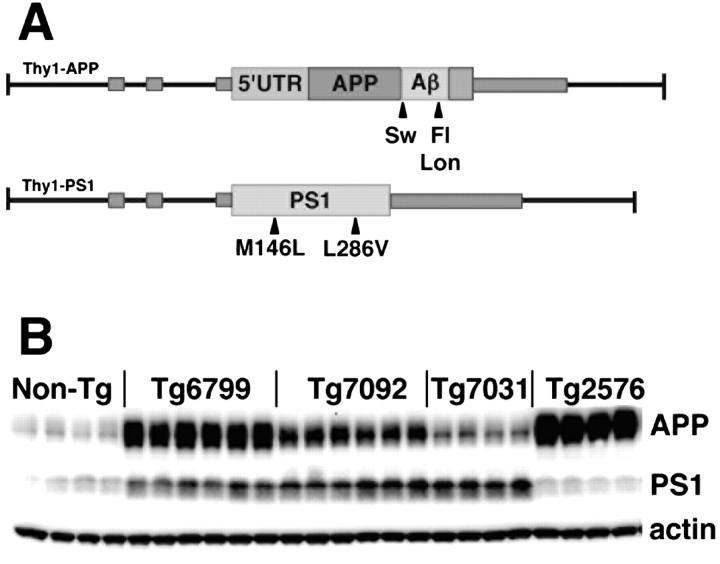
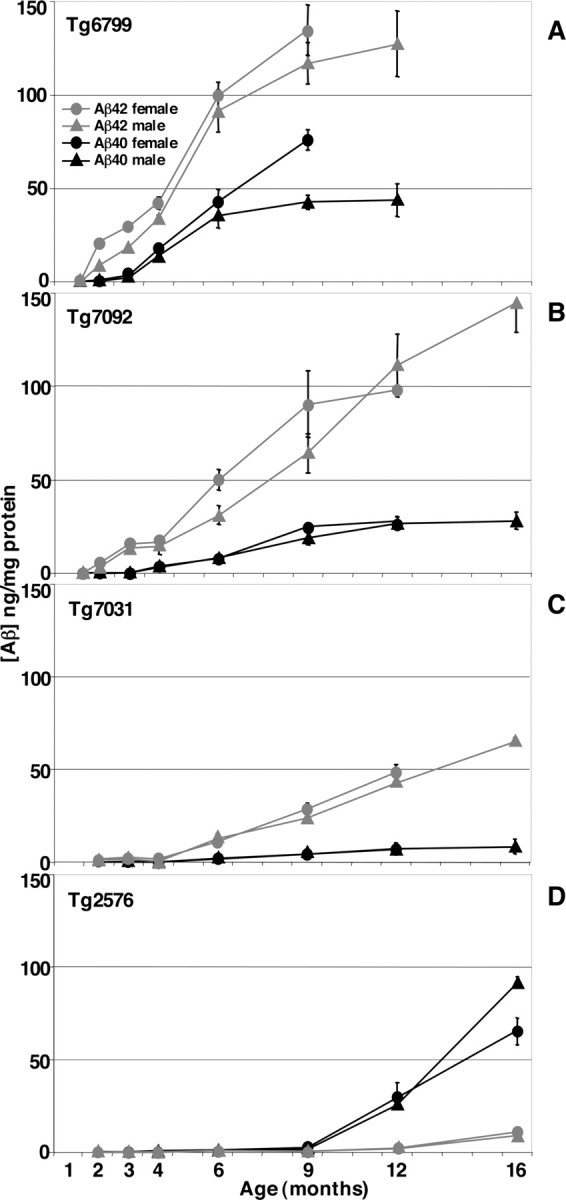
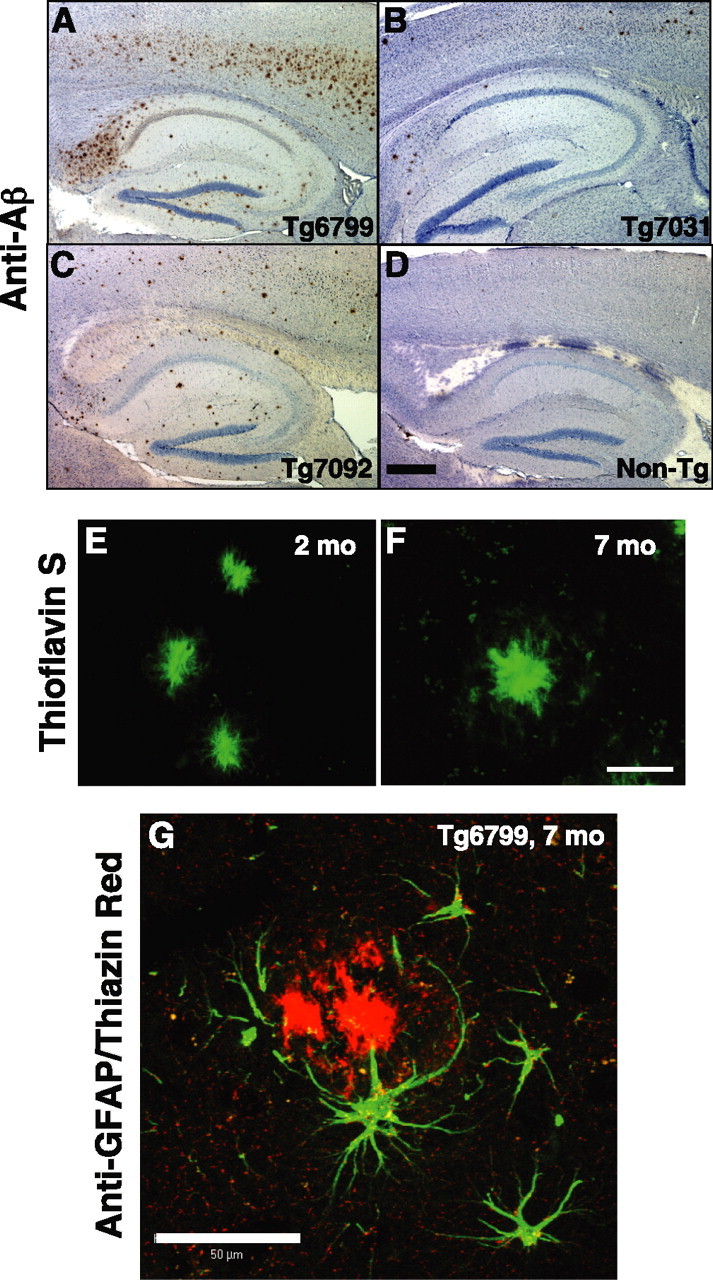
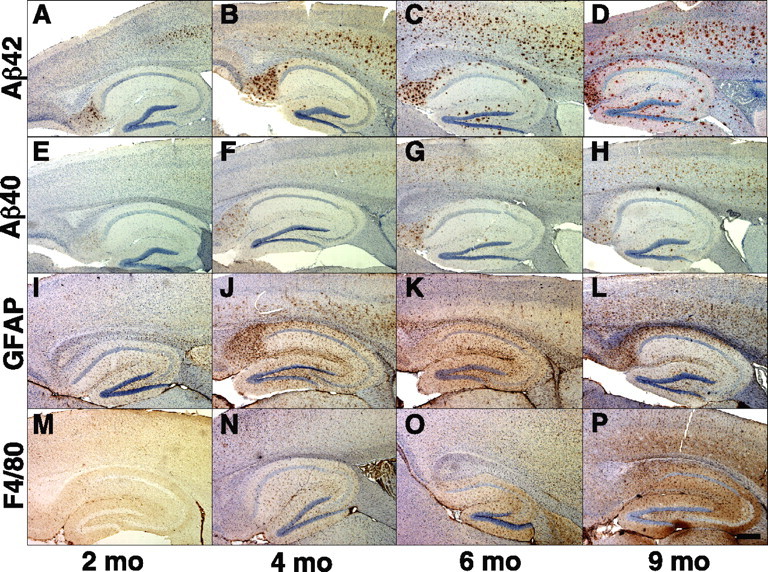
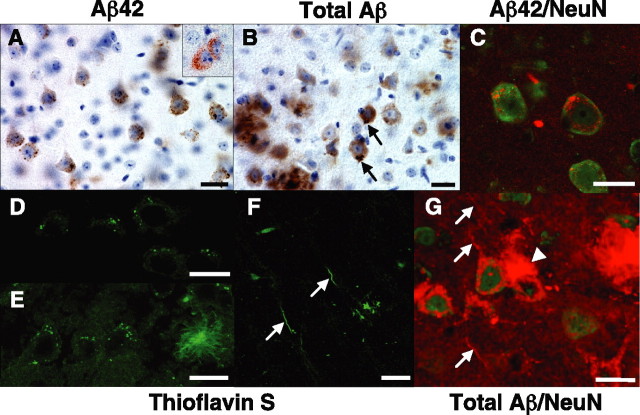
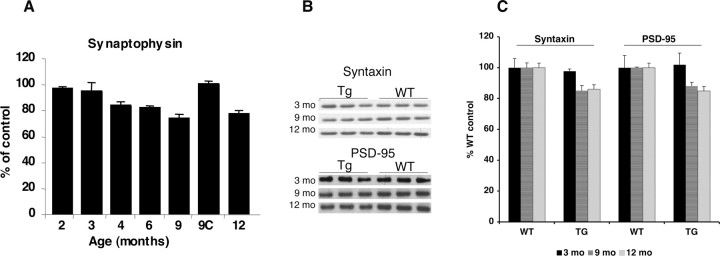
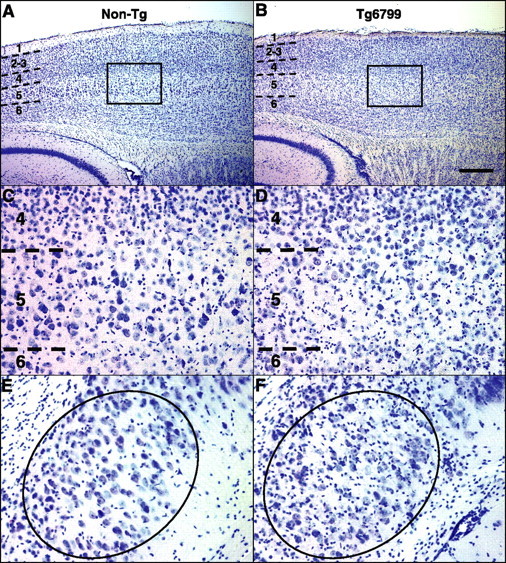
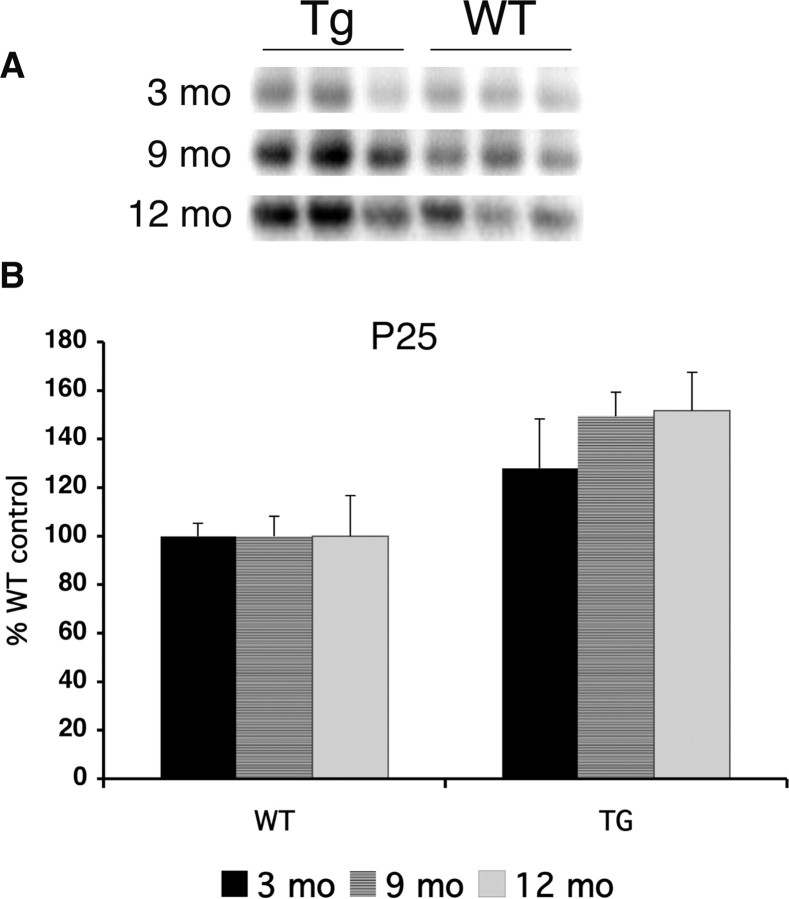
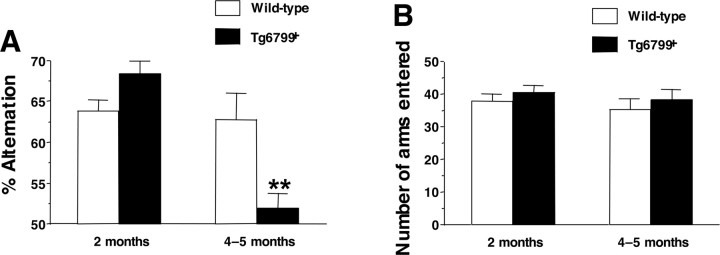
Mutations in the genes for amyloid precursor protein (APP) and presenilins (PS1, PS2) increase production of beta-amyloid 42 (Abeta42) and cause familial Alzheimer's disease (FAD). Transgenic mice that express FAD mutant APP and PS1 overproduce Abeta42 and exhibit amyloid plaque pathology similar to that found in AD, but most transgenic models develop plaques slowly. To accelerate plaque development and investigate the effects of very high cerebral Abeta42 levels, we generated APP/PS1 double transgenic mice that coexpress five FAD mutations (5XFAD mice) and additively increase Abeta42 production. 5XFAD mice generate Abeta42 almost exclusively and rapidly accumulate massive cerebral Abeta42 levels. Amyloid deposition (and gliosis) begins at 2 months and reaches a very large burden, especially in subiculum and deep cortical layers. Intraneuronal Abeta42 accumulates in 5XFAD brain starting at 1.5 months of age (before plaques form), is aggregated (as determined by thioflavin S staining), and occurs within neuron soma and neurites. Some amyloid deposits originate within morphologically abnormal neuron soma that contain intraneuronal Abeta. Synaptic markers synaptophysin, syntaxin, and postsynaptic density-95 decrease with age in 5XFAD brain, and large pyramidal neurons in cortical layer 5 and subiculum are lost. In addition, levels of the activation subunit of cyclin-dependent kinase 5, p25, are elevated significantly at 9 months in 5XFAD brain, although an upward trend is observed by 3 months of age, before significant neurodegeneration or neuron loss. Finally, 5XFAD mice have impaired memory in the Y-maze. Thus, 5XFAD mice rapidly recapitulate major features of AD amyloid pathology and may be useful models of intraneuronal Abeta42-induced neurodegeneration and amyloid plaque formation.


Figures

Figure 1.
Figure 1.
5XFAD transgenes and expression levels. A, Schematic diagram of 5XFAD APP and PS1 transgenes. FAD mutations in Thy1–APP and Thy1–PS1 transgenes are indicated by arrowheads. Sw, Swedish mutation; Lon, London mutation; Fl, FL mutation. Small gray rectangles represent Thy1 exons. Coding regions of APP and PS1 are represented by larger rectangles and are shown inserted into Thy1 exon 2 of the mouse Thy1 transgene expression cassette (Moechars et al., 1996). The APP transgene has the 5′ untranslated region (5′UTR) of APP containing an IL-1β responsive translational element (Rogers et al., 1999). B, Immunoblot analysis of 5XFAD lines showing expression levels of transgene-derived APP and PS1. Whole-brain homogenate (15 μg) from 6-month-old 5XFAD lines (Tg6799, Tg7092, and Tg7031), Tg2576, and nontransgenic controls were run on SDS-PAGE and immunoblotted, followed by detection with APP (22C11; top row) and PS1 (PS1NT; middle row) antibodies. Blots were stripped and incubated with actin antibody (bottom row) as a loading control. A representative selection of male and female mice for each line is shown. Note that 5XFAD lines express less APP than Tg2576, yet all develop amyloid deposits much earlier than Tg2576 (see Figs. 3, 4).
Figure 2.
Figure 2.
Rapid increase of cerebral Aβ42 levels in 5XFAD lines. Whole-brain homogenates from 1.5- to 16-month-old 5XFAD mice (A, Tg6799; B, Tg7092; C, Tg7031) and Tg2576 (D) were prepared in 5 m guanidine HCl to solubilize amyloid plaques, and 1 mg of total protein was analyzed by Aβ40 (black) and Aβ42 (gray) end-specific sandwich ELISAs. Aβ concentrations are expressed in nanograms per milligram of total brain protein. The means of male (triangles) and female (circles) samples are plotted separately. Four to five mice of each genotype per gender and age were analyzed. Error bars represent SEM. At young ages, 5XFAD mice generated Aβ42 almost exclusively. Aβ40 levels began to rise at older ages but were always much lower than Aβ42 levels. In contrast, for a given age, Tg2576 had very little Aβ42 compared with that of the 5XFAD lines, and Aβ40 levels were much greater than Aβ42 levels for Tg2576 at all ages. Note that the Aβ42 levels of the three 5XFAD lines are directly proportional to APP transgene expression levels (see Fig. 1B).
Figure 3.
Figure 3.
Amyloid deposition and gliosis in 5XFAD lines. Parasagittal serial sections of brains from Tg6799 (A, E–G), Tg7031 (B), Tg7092 (C), and nontransgenic control (D) mice were stained with anti-Aβ (4G8; A–D), thioflavin S (E, F), or anti-GFAP and thiazin red (G) and imaged by bright-field (A–D) or confocal (E–G) microscopy. Ages of mice were 2 (E), 6 (A–D), and 7 (F, G) months. A–D, Shown are sections including the hippocampus and cortex of representative 6-month-old 5XFAD mice from each line stained with anti-Aβ (brown) and hematoxylin (blue). Across the 5XFAD lines, the relative amounts of amyloid burden (and gliosis; data not shown) correlated with Aβ42 levels as measured by ELISA (Fig. 2). Scale bar (in D): A–D, 1 mm. E, F, Brain sections of representative 2-month-old (E) and 7-month-old (F) Tg6799 mice were stained with thioflavin S (green). Amyloid deposits labeled strongly with thioflavin S, indicating that Aβ was in an aggregated β-pleated sheet conformation. Note that plaque sizes (∼20 μm) are similar to those of large neuron cell bodies (data not shown). Scale bar (in F): E, F, 20 μm. G, Activated astrocytes around a Tg6799 plaque. Brain section of a representative 7-month-old Tg6799 mouse costained with thiazin red (to label β-pleated sheet amyloid) and anti-GFAP antibody (green). The astrocytes adjacent to the amyloid plaque display ramified processes and express GFAP, indicative of an activated phenotype associated with inflammation. Scale bar, 50 μm.
Figure 4.
Figure 4.
Rapid cerebral amyloid deposition and gliosis in 5XFAD line Tg6799. Parasagittal serial sections of brains from 2 (A, E, I, M), 4 (B, F, J, N), 6 (C, G, K, O), and 9 (D, H, L, P) month Tg6799 mice were stained with antibodies recognizing Aβ42 C terminus (A–D), Aβ40 C terminus (E–H), GFAP (I–L), and F4/80 (M–P) and counterstained with hematoxylin. Shown are sections including the hippocampus and cortex of representative Tg6799 mice from each age. Amyloid deposition began in the deep cortex and subiculum at 2 months in this line and then spread into other brain regions at older ages. Note that Aβ42 staining is much stronger than that of Aβ40 at every age and that the densities of astrocytes (GFAP) and microglia (F4/80) parallel that of the Aβ42 staining. Scale bar, 1 mm.
Figure 5.
Figure 5.
Intraneuronal Aβ accumulation in Tg6799: intracellular Aβ aggregates and plaque formation. Brain sections from representative 1.5- to 6-month-old Tg6799 mice were processed for immunocytochemistry with anti-Aβ antibodies (A–C, G) or stained with thioflavin S (D–F). Some sections were counterstained with hematoxylin (A, B) or with an antibody that recognizes the neuronal marker NeuN (green stain in C, G). Anti-Aβ antibodies used were specific for the C terminus of Aβ42 (A, brown; C, red) or recognized all forms of Aβ (B, 4G8, brown; G, R1282, red). Tg6799 ages were 1.5 (A, inset), 2 (A, C, D, F, G), 3 (E), and 6 (B) months. Intraneuronal Aβ accumulations were primarily observed as small puncta, although occasional large irregular accumulations were seen near the axon hillock (black arrows; B). Importantly, thioflavin S staining revealed intraneuronal Aβ aggregates consisting of β-pleated sheet amyloid accumulations within soma (punctate signals; D, E) and neurites (linear structures, white arrows; F). Note the thioflavin S-positive amyloid plaque (right; E). In some sections (G), an amyloid deposit (white arrowhead) was observed to originate from a neuron cell body with abnormal, disrupted-appearing morphology. This neuron had very little anti-NeuN antibody staining (green), indicating that it was likely in the process of degeneration. In addition, other neurons in the section appeared to be in various stages of degeneration (e.g., bottom right; G) and were also in close proximity to amyloid plaques (e.g., far left center; G). Note the presence of Aβ-filled neurites passing through the section (red linear structures, white arrows; G). Interestingly, plaque sizes were typically of the same magnitude as neuronal soma. Additional amyloid plaques can be seen at the bottom left in B and at the top right in G. For a movie of a three-dimensional reconstruction of the Z-stack sections in G, see supplemental material (available at www.jneurosci.org). Scale bars, 20 μm.
Figure 6.
Figure 6.
Reduced synaptophysin, syntaxin, and PSD-95 levels in Tg6799: synaptic degeneration. A, Whole-brain homogenates from 2- to 12-month-old Tg6799 and 9-month-old nontransgenic control (9C) mice were analyzed for synaptophysin by ELISA. Synaptophysin levels are expressed as the percentage of 9-month-old control whole-brain synaptophysin levels (9C is 100%). No significant gender differences were observed in Tg6799 synaptophysin levels at any given age (data not shown), so values from age-matched males and females were pooled (3 mice for each gender and age). Note the steady decline in synaptophysin levels starting at 4 months in Tg6799, eventually falling to ∼75% of control levels at 9 months. B, C, Immunoblot analysis of synaptic markers syntaxin and PSD-95 in cortex homogenates (15 mg) from Tg6799 (Tg) and nontransgenic (wild type, WT) mice (3, 9, and 12 months old). Equal loading was determined by ponceau red staining of the blots (data not shown). Immunoblot signals were captured using a PhosphorImager (B), quantified, and expressed as percentage of age-matched control (C). Note that synaptic markers are significantly reduced by 9 months of age in Tg6799, indicating neurodegeneration. Error bars represent SEM.
Figure 7.
Figure 7.
Neuron loss in cortical layer 5 and subiculum of Tg6799. Parasagittal sections of representative 9-month-old nontransgenic (Non-Tg) control (A, C, E) and Tg6799 (B, D, F) brains were stained with cresyl violet and micrographed to image layer 5 cortex (A–D) and subiculum (E, F). Numbers indicate cortical layers, and dashed lines identify boundaries between layers. Boxes in A and B delineate areas of cortex shown at higher magnification in C and D, respectively, to clearly visualize layer 5. B, D, Note that large pyramidal neurons in cortical layer 5 are visibly reduced in number in Tg6799. Moreover, layer 1 of Tg6799 cortex (B) is thinner than that of nontransgenics (A). Neuron loss is also visible in Tg6799 subiculum (oval, F) compared with that of nontransgenics (oval, E). In addition, note the large number of glia in Tg6799 subiculum (small darkly staining cells, F). Neurons are distinguishable from glial cells because of the larger size of neuronal cell body and the usual appearance of a prominent nuclear nucleolus. Layer 5 and subiculum exhibited the highest levels of both intraneuronal Aβ accumulation and amyloid deposition in Tg6799 (for Aβ42 immunostaining of a section adjacent to that in B, see Fig. 4D) Scale bar (in B): A, B, 1 mm; C–F, 100 μm.
Figure 8.
Figure 8.
p25 levels are increased in Tg6799 mice. Immunoblot analysis of the cdk5 activating subunit p25 in cortex homogenates (15 mg) from Tg6799 (Tg) and nontransgenic (wild-type, WT) mice (3, 9, and 12 months old). Equal loading was determined by ponceau red staining of the blots (data not shown). Immunoblot signals were captured using a PhosphorImager (A), quantified, and expressed as percentage of age-matched control (B). Note that p25 levels are significantly elevated by 9 months of age in Tg6799 but that a trend toward higher values can be seen at 3 months. Error bars represent SEM.
Figure 9.
Figure 9.
Memory deficits in Tg6799 mice with age. A, Spatial working memory of Tg6799 and nontransgenic littermate (Wild-type) mice was assessed by spontaneous alternation in the Y-maze (n = 12–20). Tg6799 mice showed normal alternation performance in the Y-maze at 2 months of age, but they performed poorly at 4–5 months of age (only slightly >50% chance levels) compared with nontransgenic littermate mice (F(3,62) = 13.96; p < 0.01). B, The total number of arm entries was not different between Tg6799 and nontransgenic (Wild-type) control mice, indicating similar levels of motor and exploratory activity in the Y-maze (n = 12–21). Each column represents the mean ± SEM. **p < 0.01 versus nontransgenic compared by ANOVA and post hoc Fisher's PLSD test.

References

    1. Akiyama H, Barger S, Barnum S, Bradt B, Bauer J, Cole GM, Cooper NR, Eikelenboom P, Emmerling M, Fiebich BL, Finch CE, Frautschy S, Griffin WS, Hampel H, Hull M, Landreth G, Lue L, Mrak R, Mackenzie IR, McGeer PL, et al. Inflammation and Alzheimer's disease. Neurobiol Aging. 2000;21:383–421. - PMC - PubMed
    1. Ashe KH. Learning and memory in transgenic mice modeling Alzheimer's disease. Learn Mem. 2001;8:301–308. - PubMed
    1. Bales KR, Dodart JC, DeMattos RB, Holtzman DM, Paul SM. Apolipoprotein E, amyloid, and Alzheimer disease. Mol Interv. 2002;2:363–375. - PubMed
    1. Biernat J, Mandelkow E-M, Schroter C, Lichtenberg-Kraag B, Steiner B, Berling B, Meyer H, Mercken M, Vandermeeren M, Goedert M, et al. The switch of tau protein to an Alzheimer-like state includes the phosphorylation of two serine-proline motifs upstream of the microtubule binding region. EMBO J. 1992;11:1593–1597. - PMC - PubMed
    1. Billings LM, Oddo S, Green KN, McGaugh JL, Laferla FM. Intraneuronal Abeta causes the onset of early Alzheimer's disease-related cognitive deficits in transgenic mice. Neuron. 2005;45:675–688. - PubMed

Publication types

Substances