Comparative Study
. 2006 Oct 4;26(40):10164-76.
doi: 10.1523/JNEUROSCI.2379-06.2006.

Activity-independent regulation of dendrite patterning by postsynaptic density protein PSD-95

Affiliations
Comparative Study

Activity-independent regulation of dendrite patterning by postsynaptic density protein PSD-95

Erik I Charych et al. J Neurosci. .

Abstract

Dendritic morphology determines many aspects of neuronal function, including action potential propagation and information processing. However, the question remains as to how distinct neuronal dendrite branching patterns are established. Here, we report that postsynaptic density-95 (PSD-95), a protein involved in dendritic spine maturation and clustering of synaptic signaling proteins, plays a novel role in regulating dendrite outgrowth and branching, independent of its synaptic functions. In immature neurons, overexpression of PSD-95 decreases the proportion of primary dendrites that undergo additional branching, resulting in a marked reduction of secondary dendrite number. Conversely, knocking down PSD-95 protein in immature neurons increases secondary dendrite number. The effect of PSD-95 is activity-independent and is antagonized by cypin, a nonsynaptic protein that regulates PSD-95 localization. Binding of cypin to PSD-95 correlates with formation of stable dendrite branches. Finally, overexpression of PSD-95 in COS-7 cells disrupts microtubule organization, indicating that PSD-95 may modulate microtubules to regulate dendritic branching. Whereas many factors have been identified which regulate dendrite number, our findings provide direct evidence that proteins primarily involved in synaptic functions can also play developmental roles in shaping how a neuron patterns its dendrite branches.


Figures

Figure 1.
Figure 1.
PSD-95 is expressed and is mostly nonsynaptic in hippocampal neurons at 10 DIV. A, Hippocampal neurons were grown for the indicated times and extracts were subjected to SDS-PAGE and Western blotting with an antibody to PSD-95. B, Neurons cultured for 12 DIV were double-labeled for PSD-95 and synaptophysin. Apposition of stained clusters was quantitated. Only 37.4 + 1.6% of PSD-95 clusters was synaptic (n = 36 neurons). C, Neurons cultured for 17 DIV were double-labeled for PSD-95 and synaptophysin. At this time point, a majority of dendritic PSD-95 clusters colocalize with synaptophysin (arrowheads), whereas most somatic PSD-95 clusters are smaller in size and do not colocalize with synaptophysin (arrows, inset). A minority of somatic PSD-95 clusters colocalize with synaptophysin (arrowheads, inset). Scale bars: B, C, 10 μm, inset, 3.5 μm.
Figure 2.
Figure 2.
Overexpression of PSD-95 decreases secondary dendrite number. A, Hippocampal neurons were transfected with cDNAs encoding GFP + DsRed1 by itself (vector) or GFP + PSD-95-DsRed1 (PSD-95) at 10 DIV. Scale bar, 10 μm. B, Dendrite number was assessed at 12 DIV. Overexpression of PSD-95-DsRed1 decreased secondary dendrite number over control but not primary dendrite number. n values are as follows: vector, 28; PSD-95, 27. ***p < 0.001 by Welch t test. C, Average and total dendrite lengths per neuron were assessed for control (GFP) and PSD-95 overexpressing neurons. n = 15 for both groups. *p < 0.05 by Welch t test. D, The average length of primary, but not secondary dendrite segments per neuron was decreased when neurons overexpressed PSD-95-DsRed1 compared with control. *p < 0.05 by Student's t test. E, Neither the total primary nor total secondary dendrite length per neuron was significantly altered with overexpression of PSD-95-DsRed1 compared with control. Note that with expression of PSD-95-DsRed1, there was a marginal decrease in total secondary dendrite length per neuron, likely resulting from the decrease in the number of secondary dendrites. p = 0.0508 by Welch t test. F, Left, Proportion of primary dendrites that branch is lower in the neurons that overexpress PSD-95 (Binomial ANODEV, p = 0.00039). Middle, PSD-95 has no effect on the number of excess secondary dendrites (Poisson ANODEV, p = 0.39). Right, PSD-95 has no significant effect on the proportion of secondary dendrites that branch. G, Neither primary nor secondary dendrite number was altered when neurons overexpressed PSD-95 family members SAP-97 and SAP-102 from 10–12 DIV. H, Sholl analysis of neurons shows that overexpression of PSD-95 (asterisks) results in significantly fewer dendrites at 36–63 μm from the soma compared with GFP (open squares). For each distance (9–63 μm), the effect of PSD-95 was quantified using Poisson GLMM, and p values were adjusted using Bonferroni corrections for multiple comparisons across all distances. In the range 36–63 μm, all adjusted p values were <0.002 with effect sizes increasing from 36 to 63 μm (a 36% decrease and 48% decrease, respectively). Error bars indicate SE.
Figure 3.
Figure 3.
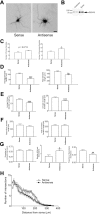
Antisense oligonucleotide knockdown of PSD-95 results in increased primary and secondary dendrite number. A, GFP fluorescence of representative hippocampal neurons that were treated with 5 μm PSD-95-specific sense (left) or antisense (right) oligonucleotides at 4, 6, 8, and 10 DIV. Cultures were transfected with cDNA encoding GFP at 10 DIV to visualize dendrites of individual neurons. B, Homogenates from sense- or antisense-treated hippocampal neuronal cultures were subjected to SDS-PAGE and Western blotting with a mouse monoclonal antibody to PSD-95 to confirm the knockdown of PSD-95 protein expression. A representative blot is shown. The average decrease in PSD-95 expression for treatment with antisense oligonucleotide was 65% (n = 3 experiments). C, Primary and secondary dendrite number was assessed at 12 DIV. Knockdown of PSD-95 results in a nonsignificant increase in primary dendrites (p = 0.0713 by Mann–Whitney test). The number of secondary dendrites was higher in antisense-treated cultures (*p = 0.0298 as determined by Mann–Whitney test; sense, n = 32; antisense, n = 33). D, Average and total dendrite lengths were assessed for control (sense) and sense oligonucleotide-treated neurons. n = 28 for both groups. **p < 0.01; ***p < 0.001 by Mann–Whitney test. E, The average length per neuron of primary (left) and secondary (right) dendrites were significantly decreased when cultures were treated with PSD-95 antisense ODNs compared with sense control. ***p < 0.001 by Mann–Whitney test. F, The total length per neuron of primary (left) and secondary (right) dendrites was unchanged when cultures were treated with PSD-95 antisense ODNs compared with sense control. G, Left, The proportion of primaries that branch is not significantly different between sense- and antisense-treated neurons. Middle, Treatment with antisense ODN increases the number of excess secondary dendrites compared with sense ODN (p = 0.039 after Bonferroni multiple comparisons test). Right, Treatment with antisense ODN significantly decreased the proportion of secondary dendrites that branch. **p < 0.01 by Mann–Whitney test. H, Sholl analysis shows that antisense significantly increases dendrite number compared in the region 9–18 μm from the soma boundary (p < 0.0001). Multiple comparison adjustments were made using Bonferroni multiple comparisons test for the differential effects of the constructs and across distances 9–63 μm. Scale bar, 10 μm. Error bars indicate SE.
Figure 4.
Figure 4.
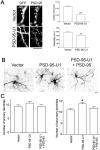
Knocking down PSD-95 protein levels by 5′ end-mutated U1 snRNA results in increased secondary dendrite number. A, Left, Hippocampal neurons were transfected with cDNAs encoding the indicated constructs on DIV 10. Endogenous PSD-95 protein was assessed by immunostaining at 17 DIV. Right, Transfected neurons were analyzed for size and intensity of PSD-95 clusters. n values are as follows: vector, 10; PSD-95–3′UTR-U1, 8. **p < 0.01 and ****p < 0.0001 by Student's t test (cluster area) or Mann–Whitney test (intensity). B, Hippocampal neurons were transfected with cDNAs encoding the indicated constructs at 10 DIV. C, Dendrite number was assessed at 17 DIV. *p < 0.05 as determined by ANOVA followed by Dunnett multiple-comparisons test compared with vector control. PSD-95-U1 + PSD-95 is constructed a plasmid with bicistronic coding for PSD-95-GFP lacking the 3′UTR (U1 recognition site) and PSD-95-U1. PSD-95-GFP restores dendrite numbers to control values (vector). Coexpression of PSD-95-U1 with PSD-95-DsRed1 also restores dendrite numbers to control values (data not shown). n values are as follows: vector, 26; PSD-95–3′UTR-U1, 20; PSD-95–3′UTR-U1 + PSD-95, 21. Scale bars: A, B, 10 μm. Error bars indicate SE.
Figure 5.
Figure 5.
PSD-95 inhibition of branching is activity-independent. A, Hippocampal neurons were transfected with cDNAs encoding GFP by itself (vector) or with PSD-95-dsRed1 (PSD-95) at 10 DIV and were treated with either vehicle, 50 μm APV, 10 μm CNQX, or 1 μm TTX for 24 h. Dendrite number was assessed at 12 DIV. B, APV treatment but not PSD-95 overexpression decreases primary dendrite number. Both PSD-95 and APV decreased secondary dendrite number, and the effect is larger when both treatments are performed. n values are as follows: GFP, 10; GFP + APV, 10; PSD-95, 10; PSD-95 + APV, 14. **p < 0.01; ***p < 0.001 by ANOVA with Tukey–Kramer test for correction for multiple comparisons. C, Neither CNQX treatment nor PSD-95 overexpression changes the number of primary dendrites. Both conditions decrease the number of secondary dendrites. n values are as follows: GFP, 30; GFP + CNQX, 28; PSD-95, 27; PSD-95 + CNQX, 22. *p < 0.05; **p < 0.01; ***p < 0.001 by ANOVA with Tukey–Kramer test for correction for multiple comparisons. D, Neither TTX treatment nor PSD-95 overexpression changes the number of primary dendrites. n values are as follows: GFP, 30; GFP + TTX, 26; PSD-95, 27; PSD-95 + TTX, 17. *p < 0.05; **p < 0.01 by ANOVA with Tukey–Kramer test for correction for multiple comparisons. E, Sholl analysis shows that none of the treatments (APV, CNQX, TTX) block PSD-95 effects on dendrite branching. In fact, the effects are likely additive with PSD-95 overexpression proximal to the cell body. F, Proximal Sholl analysis (from E) within the first 63 μm of the soma. Left, APV does not block the effect of PSD-95 (p > 0.38 for all distances, testing for block or cancellation of the effect of PSD-95 by APV + 95). Middle, CNQX does not block the effect of PSD-95 (p > 0.99 for all distances, testing for block or cancellation of the effect of PSD-95 by CNQX + 95). Right, TTX does not block the effect of PSD-95 (p > 0.99 testing for block or cancellation of the effect of PSD-95 by TTX). All analyses were done using Poisson GLMM and ANODEV. Error bars indicate SE.
Figure 6.
Figure 6.
PSD-95 stops cypin-promoted dendritic branching. A, Hippocampal neurons were transfected with cDNAs encoding the indicated constructs on DIV 10. Scale bar, 10 μm. B, Dendrite number was assessed at 12 DIV. Overexpression of PSD-95-DsRed1 decreased cypin-promoted increases in primary and secondary dendrite number (cypin + PSD-95). PSD-95 decreased secondary dendrite number below basal (GFP) levels regardless of cypin overexpression. n values are as follows: GFP, 33; GFP + PSD-95-dsRed, 10; cypin, 30; cypin + PSD-95-dsRed, 20. *p < 0.05 and ***p < 0.001 by Kruskal–Wallis test followed by Dunn's multiple-comparisons test. C, left, Overexpression of PSD-95 decreases the proportion of primary dendrites that branch (ANODEV, p = 0.0003). PSD-95 blocks the effect of cypin (p = 0.81). Right, Cypin increases the number of excess secondary dendrites (ANODEV, p = 0.00002), and overexpression of PSD-95 blocks this effect. Error bars indicate SE.
Figure 7.
Figure 7.
PSD-95 binding is essential for stabilizing cypin-promoted dendrites. A, Hippocampal neurons were transfected with cDNAs encoding the indicated constructs (N-terminally tagged with GFP) at 10 DIV and the number of primary and secondary dendrites were assessed at 12 (white bars) and 17 DIV (black bars). Overexpression of cypin resulted in increased primary and secondary dendrite number at both 12 and 17 DIV; however, overexpression with cypin-PDZ, a mutant that cannot interact with PSD-95, resulted in a transient increase in dendrite number at 12 but not 17 DIV. n values are as follows: 12 DIV, GFP, 33; cypin, 30; cypin-PDZ, 24; 17 DIV, GFP, 20; cypin, 29; cypin-PDZ, 12. *p < 0.05; ** p < 0.01; ***p < 0.001 by Kruskal–Wallis test followed by Dunn's multiple comparisons test as compared with GFP control. XX p < 0.01; XXX p < 0.001 versus GFP at 12 DIV. O p < 0.05; OOO p < 0.001 versus GFP at 17 DIV. B, Statistics collected for the samples of neurons in the different populations (GFP, cypin, cypin-PDZ). Left, 12 DIV; right, 17 DIV. The proportion of primary dendrites that branch is the same for all neurons (top row) for both time points (p = 0.17 and 0.49 respectively). The number of excess secondary branches is higher for neurons that overexpress cypin than GFP and cypin-PDZ. p < 1 × 10⁻¹⁶ for cypin and p = 0.8 for cypin-PDZ versus GFP control at 12 DIV; p = 2.8 × 10⁻⁷ for cypin and p = 0.37 for cypin-PDZ versus GFP control at 17 DIV. C, Hippocampal neuronal cultures were treated with PSD-95 antisense ODN or sense controls until 17 DIV. The increase in the number of secondary dendrites by treatment with PSD-95 antisense ODNs at 12 DIV was lost by 17 DIV. Note that there was a significant increase in the number of primary dendrites when cultures were treated with PSD-95 antisense compared with sense control at 17 DIV. *p < 0.05 by Mann–Whitney test. Error bars indicate SE.
Figure 8.
Figure 8.
PSD-95 overexpression disrupts microtubule organization in COS-7 cells. A, COS-7 cells were transfected with cDNA encoding PSD-95 fused to either GFP or DsRed1 and labeled with a mouse monoclonal antibody to acetylated tubulin, to visualize MTs. Control cells were transfected with cDNA encoding GFP or DsRed1 alone. In these cells, PSD-95 fused to either GFP or DsRed1 formed large aggregates in the perinuclear region as well as smaller aggregates throughout the cell. Immunolabeling with anti-acetylated tubulin shows that, in contrast to control cells that exhibit astral MT bundles originating from a single MTOC, most cells transfected with PSD-95 exhibit an irregular MT organization such that the bundles wind circuitously around a central axis. Alternatively, MTs formed tight cages around large PSD-95 aggregates (data not shown). This suggests that PSD-95 alters the distribution of microtubules. To visualize the anti-acetylated tubulin antibody, a Cy5-conjugated goat anti-mouse secondary antibody was used. Scale bar, 40 μm. B, COS-7 cells were transfected with cDNA encoding PSD-95-DsRed1 and tubulin-GFP to visualize the above phenomenon in living cells. The tubulin-GFP was assembled into MT bundles that assumed a circuitous pattern in the cell cotransfected with cDNA encoding PSD-95-DsRed1 (bottom left), compared with a neighboring cell transfected only with cDNA encoding tubulin-GFP (top right), which exhibits a normal microtubule arrangement, as described above. The inset shows the dual-channel image, with PSD-95-DsRed1 fluorescence on the left and tubulin-GFP fluorescence on the right. Note that only the cell on the bottom-left is expressing both PSD-95-DsRed1 and tubulin-GFP. Scale bar: 30 μm; inset, 75 μm. C, Overexpression of PSD-95 fused to either GFP or DsRed1 significantly increased the proportion of cells exhibiting an irregular microtubule arrangement compared with neighboring untransfected cells, or to cells transfected with GFP or DsRed1 alone. For each of the indicated constructs, the percentage of transfected cells (white bars) and neighboring untransfected cells (black bars) exhibiting irregular MT arrangement was determined. As indicated, 72% (±10.6%) of cells transfected with PSD-95-GFP had irregular MTs compared with 16.9% (±2.7%) neighboring untransfected cells and 16.3% (±4.2%) of GFP-transfected cells. Similarly, 60.6% (±17.7%) of cells transfected with PSD-95-DsRed had irregular MTs compared with 15.9% (±0.12%) neighboring untransfected cells and 21.2% (±7.6%) of cells transfected with DsRed1 alone. n values are 2 for GFP, 3 for PSD-95-GFP, 2 for DsRed1, and 2 for PSD-95-DsRed1. *p < 0.05; **p < 0.01 by one-way ANOVA followed by Student–Newman–Keuls test for multiple comparisons. Error bars indicate SE.
Figure 9.
Figure 9.
Model for PSD-95-regulated dendrite branching. A, PSD-95 has been shown to increase the surface expression of NMDA (Lin et al., 2004) and AMPA receptors (Chen et al., 2000; El-Husseini et al., 2000; Schnell et al., 2002; Cuadra et al., 2004; Ehrlich and Malinow, 2004). *Because neuronal activity positively regulates dendritic branching (McAllister et al., 1996; Jin et al., 2003; Yu and Malenka, 2003), PSD-95 overexpression would be expected to increase dendritic branching. However, we found that PSD-95 overexpression has a negative impact on dendritic branching, suggesting that PSD-95 acts via a mechanism that is independent of and dominant over any concurrent PSD-95-induced increases in neuronal activity. B, In control neurons (GFP), PSD-95 (filled circles) acts to inhibit secondary dendrite growth, whereas PSD-95 overexpression results in decreased secondary dendrites. Conversely, when PSD-95 is knocked down, secondary dendrite number is transiently increased (dashed lines). Some PSD-95 clusters in the cell body may be decreased (smaller filled circles), resulting in an insignificant (p = 0.0713) increase in primary dendrite number at 12 DIV, but becoming significantly larger when PSD-95 knockdown treatment is maintained until 17 DIV. This suggests that a longer knockdown regimen is needed to relieve the inhibition on primary dendrite outgrowth by somatic PSD-95, which is localized at a higher density than dendritic PSD-95 (Fig. 1 C). Overexpression of cypin causes an increase in primary and secondary dendrites, some of which are pruned later in development (dashed lines). When cypin-PDZ is expressed, PSD-95 clusters are unchanged and secondary dendrite formation is inhibited. C, PSD-95 acts as a stop signal for secondary dendrite formation, possibly by disrupting MT growth and organization. Decreased PSD-95 clustering, regulated by the PDZ binding of cypin, results in increased secondary dendrite number. Alternatively, cypin-independent regulation of dendrite formation, such as inhibition of primary dendrite outgrowth by somatic PSD-95, may exist. In parallel, cypin increases both primary and secondary dendrite formation by promoting microtubule assembly.

Similar articles

Cited by

References

    1. Aizawa H, Hu SC, Bobb K, Balakrishnan K, Ince G, Gurevich I, Cowan M, Ghosh A. Dendrite development regulated by CREST, a calcium-regulated transcriptional activator. Science. 2004;303:197–202. - PubMed
    1. Akum BF, Chen M, Gunderson SI, Riefler GM, Scerri-Hansen MM, Firestein BL. Cypin regulates dendrite patterning in hippocampal neurons by promoting microtubule assembly. Nat Neurosci. 2004;7:145–152. - PubMed
    1. Brenman JE, Christopherson KS, Craven SE, McGee AW, Bredt DS. Cloning and characterization of postsynaptic density 93, a nitric oxide synthase interacting protein. J Neurosci. 1996;16:7407–7415. - PMC - PubMed
    1. Brenman JE, Topinka JR, Cooper EC, McGee AW, Rosen J, Milroy T, Ralston HJ, Bredt DS. Localization of postsynaptic density-93 to dendritic microtubules and interaction with microtubule-associated protein 1A. J Neurosci. 1998;18:8805–8813. - PMC - PubMed
    1. Chen L, Chetkovich DM, Petralia RS, Sweeney NT, Kawasaki Y, Wenthold RJ, Bredt DS, Nicoll RA. Stargazin regulates synaptic targeting of AMPA receptors by two distinct mechanisms. Nature. 2000;408:936–943. - PubMed

Publication types

Substances

LinkOut - more resources