Comparative Study
. 2006 Oct 4;26(40):10209-21.
doi: 10.1523/JNEUROSCI.3028-06.2006.

Bidirectional trafficking of prostaglandin E2 receptors involved in long-term potentiation in visual cortex

Affiliations
Comparative Study

Bidirectional trafficking of prostaglandin E2 receptors involved in long-term potentiation in visual cortex

Yukio Akaneya et al. J Neurosci. .

Abstract

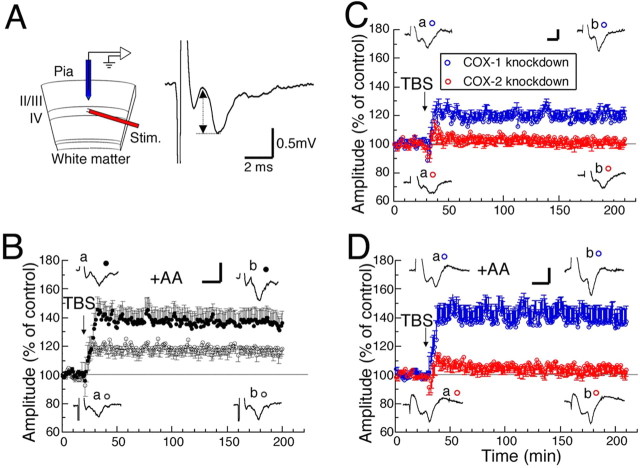
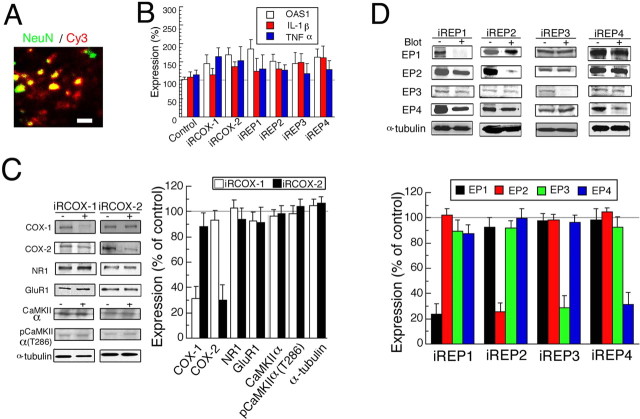
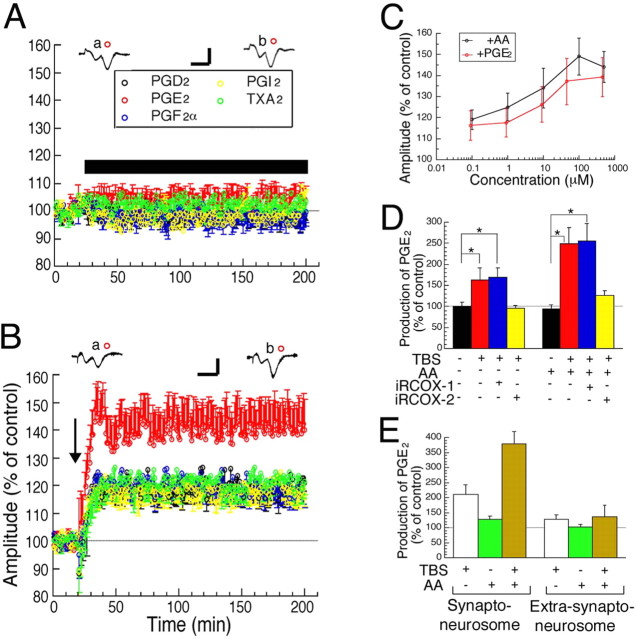
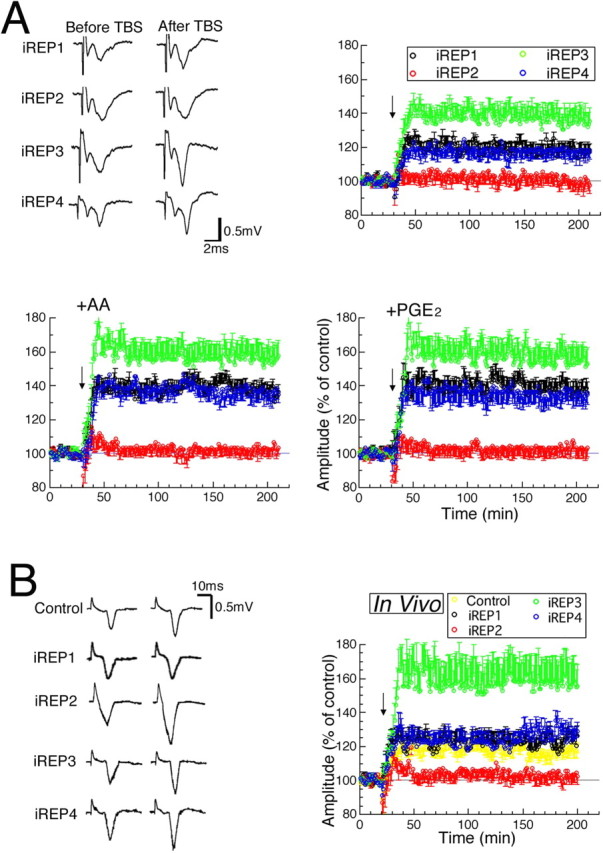
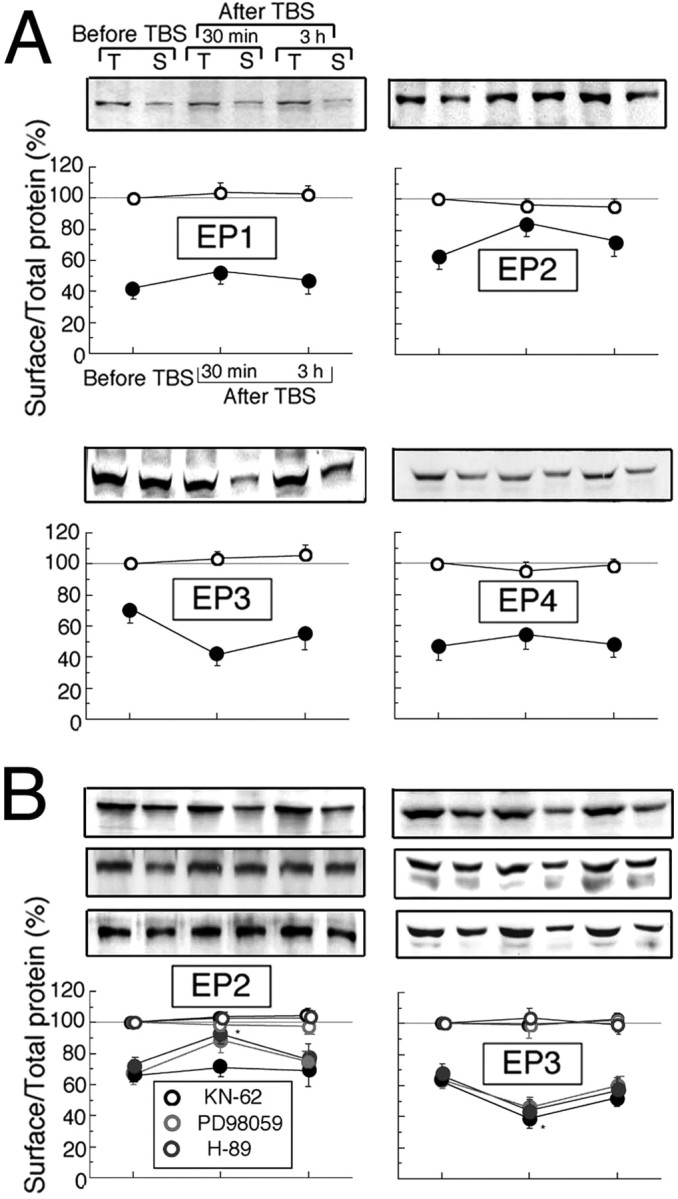
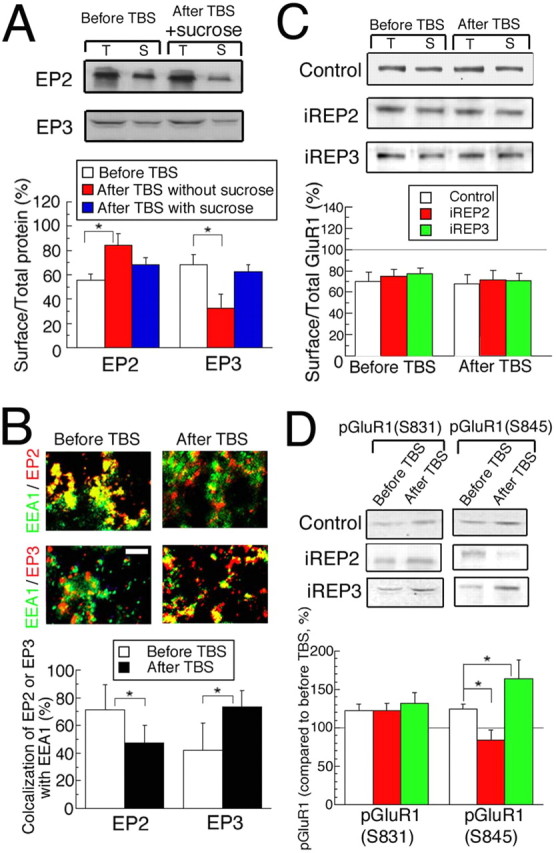
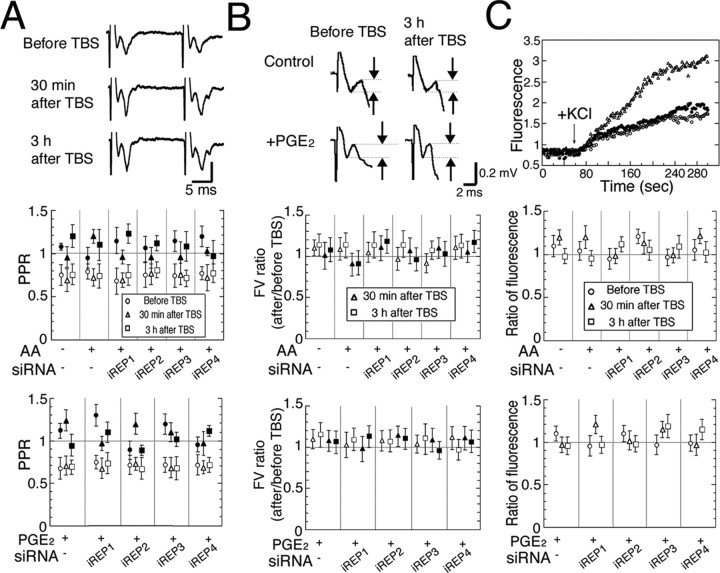
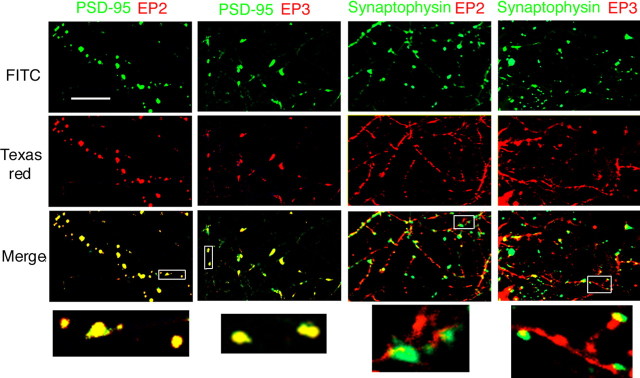
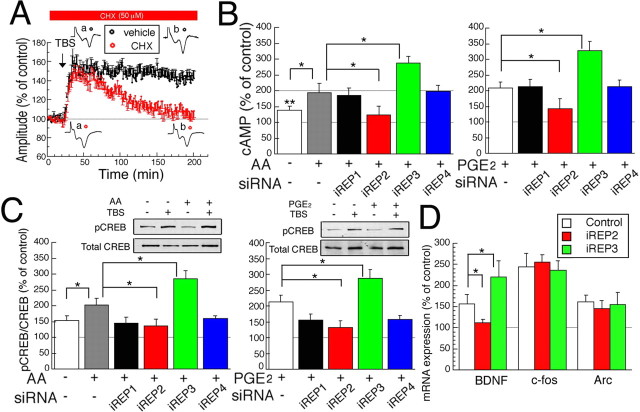
Although prostaglandin E2 (PGE2) has a broad spectrum of biological activities that have been confirmed by previous studies, the roles of PGE2 in synaptic plasticity such as long-term potentiation (LTP) in the CNS have yet to be characterized in detail. The present results of electrophysiological and biochemical studies indicated that PGE2 is actually produced in acute visual cortex slices in response to theta-burst stimulation (TBS) and is involved postsynaptically in TBS-induced LTP. RNA interference (RNAi) for PGE2 receptor subtypes EP2 and EP3, which are known to upregulate and downregulate the level of cAMP, respectively, induced significant decreases and increases of LTP, respectively. Moreover, analysis of the localization of receptor subtypes at the membrane surface or cytosol showed that stimuli such as TBS regulate the trafficking of EP2 and EP3 between the membrane and cytosol of the postsynapses, rising up to and leaving the membrane, respectively, resulting in increased and decreased expression of EP2 and EP3 at the membrane, respectively. Increased activation of EP2 and decreased activation of EP3 by PGE2 synergistically induce an increase in cAMP level, which may induce LTP. This causes activation of CREB (cAMP response element-binding protein) in the postsynaptic cells, which may be involved in the maintenance of LTP. These observations indicate that in TBS-induced LTP of the visual cortex, PGE2 is released from the postsynaptic cells and then activates PGE2 receptors at the postsynaptic membranes, which is regulated by trafficking of the differential PGE2 receptor subtypes in an activity-dependent bidirectional manner.


Figures

Figure 1.
Figure 1.
Effects of AA on LTP in normal and COX-1- or COX-2-knocked-down visual cortex. A, Schematic diagram of cortical slice used for electrophysiological recordings (left) and example of fEP (right). Left, II/III, IV, and Stim represent layer II/III, layer IV of the cortex, and stimulating electrode, respectively. Right, Double-headed arrow indicates the measured amplitude of the postsynaptic component of fEP. B, Time courses of mean amplitudes of fEPs with (filled circles, n = 8) and without (open circles, n = 7) AA. Error bars indicate SEM. Representative traces of fEPs recorded at 0∼10 min before and 170∼180 min after TBS are shown as a and b, respectively. C, D, Time courses of mean amplitudes of fEPs obtained in slices of COX-2 (red circles)- and COX-1 (blue circles)-knocked-down cortex without (C) and with (D) AA. C, n = 7 for both types of slices. D, n = 7 and 8 for knockdown of COX-1 and COX-2, respectively. Other conventions are the same as those in B. The calibrations in B–D are the same as those in A.
Figure 2.
Figure 2.
Knockdown of COX-1, COX-2, and EP1–4 by RISLE. A, Immunohistochemically stained cortex to which Cy3-conjugated siRNA (iREP2 antisense) was applied by electroporation. NeuN and Cy3 are marked by green and red, respectively. Scale bar, 10 μm. B, The expression level of OAS1, IL-1β, or TNFα was measured in the tissues of the visual cortex subjected to RISLE with or without the indicated siRNA. C, D, Western blot analysis of indicated proteins was performed by RISLE with iRCOX-1 or iRCOX-2 (C) or with iREP1–4 (D). The left (C) or top (D) panels of each graph show representative expression of the indicated proteins without (−) or with (+) RISLE. In the graphs the data were normalized to those of the contralateral side of tissues that were not subjected to RISLE. B, n = 7–9, C, n = 7–9, D, n = 7–10. Error bars indicate SEM.
Figure 3.
Figure 3.
Involvement of PGE2 in LTP. A, B, Time courses of mean amplitudes of fEPs without (A) and with (B) TBS in cortical slices to which each of the prostaglandins was applied, as indicated by respective colors. The number of slices was 7–8 for each condition. The horizontal bar indicates the time when each prostaglandin was applied. The arrow in B indicates the time when TBS was applied. The calibration bars in A and B are the same as those in Figure 1A. C, Dose–response curve of AA- and PGE2-induced enhancement of fEP amplitude 170∼180 min after TBS. The numbers of slices were 7–9. D, E, The level of PGE2 was measured in slices of the visual cortex 30 min after TBS with total tissues (D) or with synaptoneurosomes and extra-synaptoneurosomes (E). The data were normalized to those from the contralateral side as a control. The numbers of slices were 7–10 in D and 7 in E. *Statistically significant difference (p < 0.05, ANOVA). Error bars indicate SEM.
Figure 4.
Figure 4.
Effects of knockdown of EP1–4 by RISLE on LTP. Time courses of mean amplitude of fEPs of visual cortex in which each PGE2 receptor subtype was knocked down are shown, as indicated by respective colors. Arrows indicate the time when TBS was applied. A, Representative fEPs from 0∼10 min before and 170∼180 min after TBS (top left) and the mean values obtained from slices without AA and PGE2 (top right) (n = 7–8). The values from slices to which AA and PGE2 were applied are shown in the lower left and right, respectively (n = 7–9 and 7–8, respectively). B, Representative fEPs from 0∼10 min before and 170∼180 min after TBS (left), and time courses of mean fEP amplitudes recorded from in vivo visual cortex (right) (n = 7–8).
Figure 5.
Figure 5.
Changes in subcellular distribution of each subtype of PGE2 receptors after TBS. A, B, The surface/total expression ratios of EP1–4 protein assayed before and 30 min and 3 h after TBS are indicated by filled circles, whereas the total expression levels of EP1–4 are indicated by open circles. The data were normalized to those of total expression without TBS as control. A, Mean values obtained without inhibitors. Error bars, which indicate SEM, are shown only when they are larger than the size of symbols (EP1, n = 7; EP2, n = 8; EP3, n = 8; EP4, n = 7). Top panels above each graph show representative expression of EP1–4. T, Total; S, surface expression. B, Mean values obtained with KN-62, H-89, and PD98059 (EP2, n = 7; EP3, n = 7). Top panels above each graph show representative expression of EP2 and EP3 with KN-62 (top), H-89 (middle), and PD98059 (bottom). *Significant difference from the results before TBS (p < 0.05, ANOVA).
Figure 6.
Figure 6.
Mechanisms of TBS-induced LTP. A, The surface/total expression ratio of EP2 and EP3 protein assayed before and 30 min after TBS in cortical slices, which were treated for 10 min with 0.5 m sucrose before TBS. Top, Representative expression of each of EP2 and EP3 with or without sucrose (n = 7–8). B, Slices immunostained with anti-EEA 1 antibody (green) and anti-EP2 or -EP3 antibody (red) before or 30 min after TBS. Scale bar, 10 μm. Bottom, The ratio of intensities of the yellow signal to the total intensities of the green and red signals in each image (100 × 100 μm) was calculated before and after TBS. The number of images used was 52 and 63 before and after TBS, respectively. *Significant difference from the results before TBS (p < 0.05, ANOVA in A or unpaired t test in B). C, The ratios of surface/total protein of GluR1 measured before and 30 min after TBS as in A. T, Total; S, surface expression (n = 7–8). D, Phospho-GluR1 at serine 831 or 845 [pGluR1(S831) or pGluR1(S845), respectively] in tissues was measured before and 30 min after TBS (n = 7–8). Error bars indicate SEM.
Figure 7.
Figure 7.
A–C, No changes in PPR of fEPs (A), FVs (B), and released glutamate (C) after the induction of LTP. Open and filled symbols with error bars indicate values obtained without and with bicuculline (1 μm), respectively. A, Top, Representative fEPs evoked by paired-pulse stimulation at an interval of 20 ms. Middle, Bottom, Mean PPRs under the conditions indicated. Circles, triangles and squares indicate the mean values obtained before, and 30 min and 3 h after TBS, respectively. Vertical lines indicate 2 SEMs (n = 7–8). B, Mean ratio of FVs of fEPs after TBS to those before TBS. Top, Representative traces of early phase of fEPs. Note that the time scale is expanded, compared with that of A. Measured amplitudes of FVs are shown as intervals between broken lines. C, Top, Representative time courses of GRS before (open circles) and 30 min after TBS (closed circles) without AA and PGE2 and that obtained after pretreatment with BDNF (triangles). In the middle (with AA) and bottom (with PGE2), the fluorescence intensities that were normalized to those from the contralateral side as a control (n = 7–9) are shown. Error bars indicate SEM.
Figure 8.
Figure 8.
Immunocytochemistry for EP2, EP3, PSD-95, and synaptophysin in neurons from visual cortex cultured for 10–11 d. The green color represents PSD-95 or synaptophysin whereas the red color represents EP2 or EP3, as indicated. Scale bar, 5 μm. Bottom, Magnified images of insets in the merged images.
Figure 9.
Figure 9.
Effect of PGE2 on L-LTP and generation of cAMP, and activation of CREB by TBS. A, Time course of mean amplitude of fEPs with CHX, protein synthesis inhibitor (red), and those with vehicle alone (black). The horizontal bar indicates the period when CHX or vehicle was applied. Tests with CHX-treated slices were interleaved with control slices with vehicle alone. Number of slices was 7 for each. B, cAMP level after TBS with or without AA (left) or PGE2 (right). The conditions under which cAMP level was measured are indicated along the abscissa (n = 7–8). *Significant differences between indicated groups; **significant differences in comparison with control (p < 0.05, ANOVA). C, Ratio of pCREB/total CREB in cortical layer II/III after TBS without or with AA (left) or PGE2 (right). The top panels show representative expressions of pCREB and total CREB (n = 7–9). B, C, The data were normalized to those from the contralateral side as control. D, mRNA expression level of BDNF, c-Fos, and Arc measured by real-time PCR 3 h after TBS using control, and EP2- and EP3-knockdown rats (n = 7–8). The data are normalized to control (before TBS). Error bars indicate SEM.

Similar articles

Cited by

References

    1. Abel T, Nguyen PV, Barad M, Deuel TA, Kandel ER, Bourtchouladze R. Genetic demonstration of a role for PKA in the late phase of LTP and in hippocampus-based long-term memory. Cell. 1997;88:615–626. - PubMed
    1. Adesnik H, Nicoll RA, England PM. Photoinactivation of native AMPA receptors reveals their real-time trafficking. Neuron. 2005;48:977–985. - PubMed
    1. Akaneya A, Jiang B, Tsumoto T. RNAi-induced gene silencing by local electroporation in targeting brain region. J Neurophysiol. 2005;93:594–602. - PubMed
    1. Akaneya Y, Tsumoto T, Kinoshita S, Hatanaka H. Brain-derived neurotrophic factor enhances long-term potentiation in rat visual cortex. J Neurosci. 1997;17:6707–6716. - PMC - PubMed
    1. Alvarez VA, Ridenour DA, Sabatini BL. Retraction of synapses and dendritic spines induced by off-target effects of RNA interference. J Neurosci. 2006;26:7820–7825. - PMC - PubMed

Publication types

MeSH terms