Comparative Study
. 2006 Oct 4;26(40):10222-31.
doi: 10.1523/JNEUROSCI.2250-06.2006.

Alterations in memory networks in mild cognitive impairment and Alzheimer's disease: an independent component analysis

Affiliations
Comparative Study

Alterations in memory networks in mild cognitive impairment and Alzheimer's disease: an independent component analysis

Kim A Celone et al. J Neurosci. .

Abstract

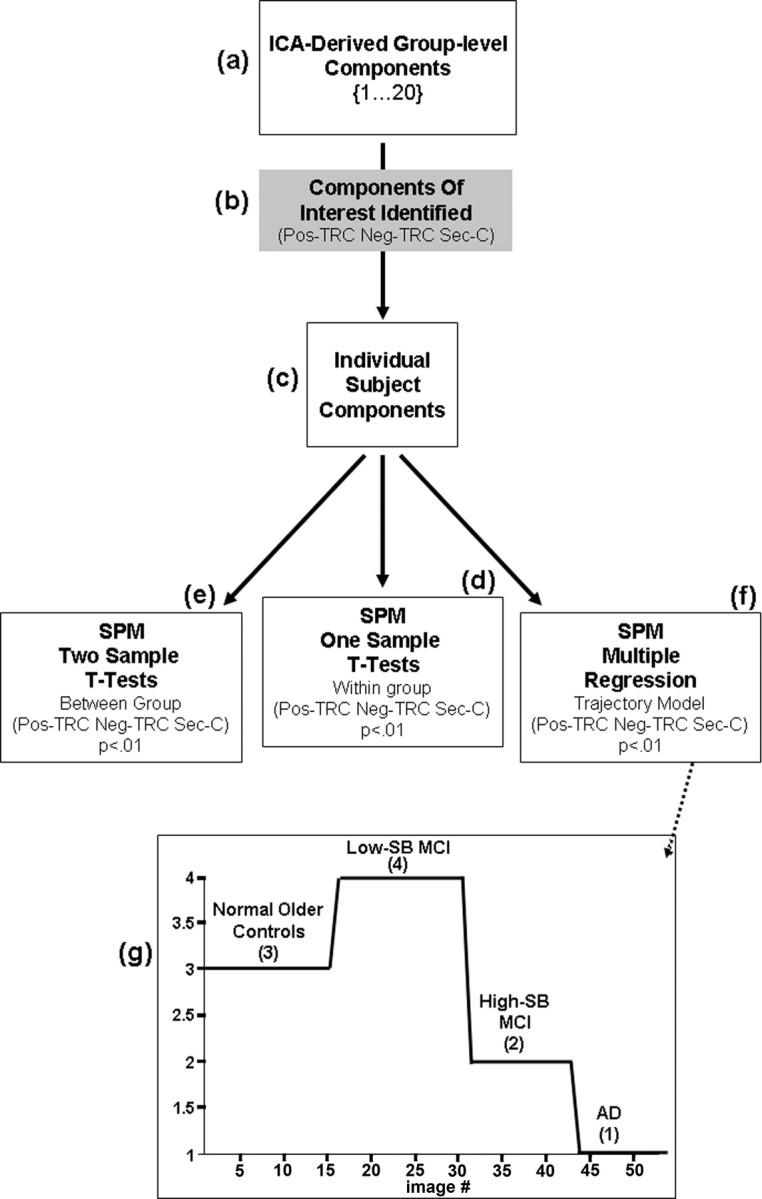
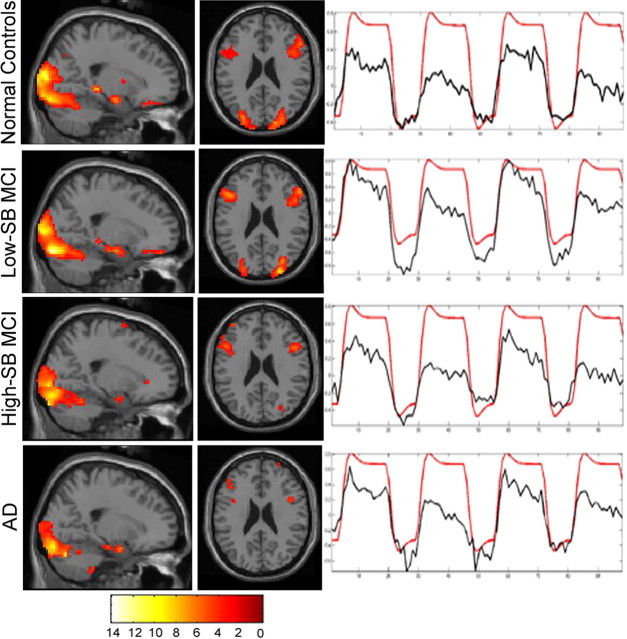
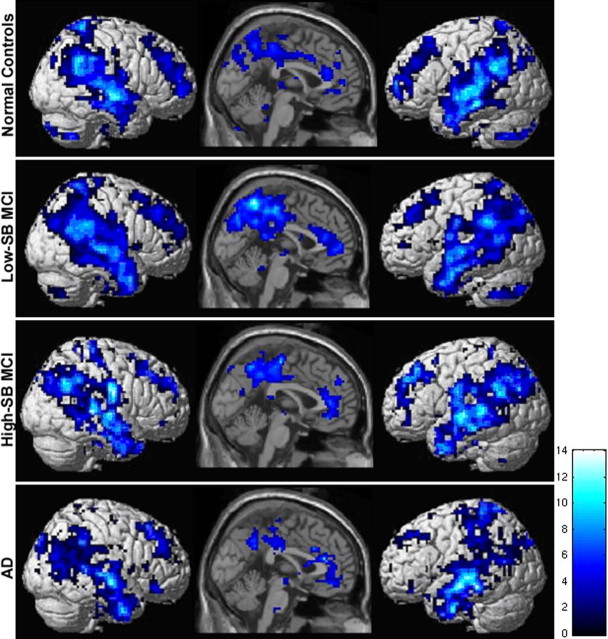
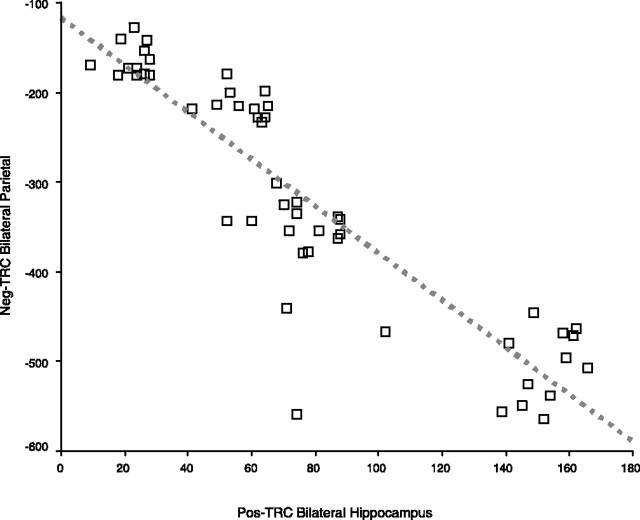
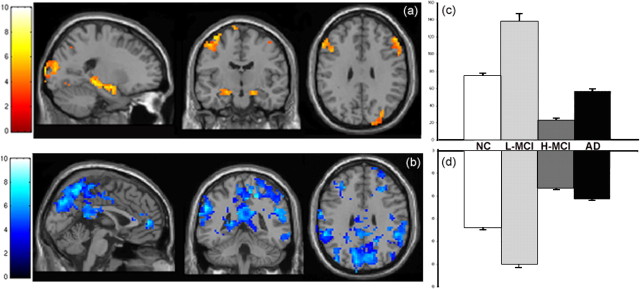
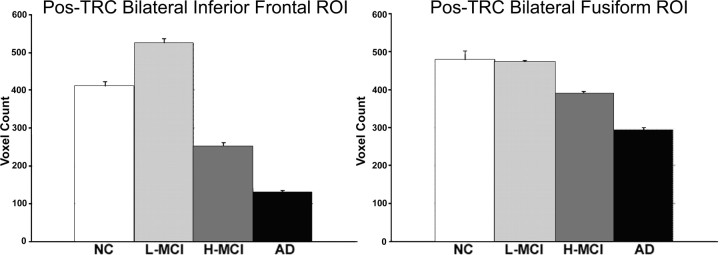
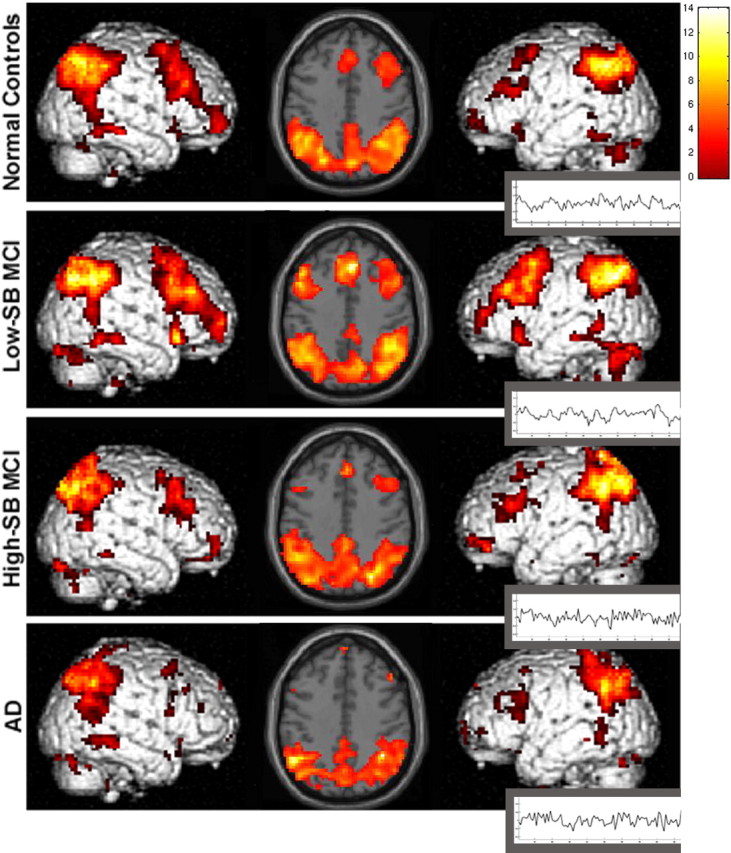
Memory function is likely subserved by multiple distributed neural networks, which are disrupted by the pathophysiological process of Alzheimer's disease (AD). In this study, we used multivariate analytic techniques to investigate memory-related functional magnetic resonance imaging (fMRI) activity in 52 individuals across the continuum of normal aging, mild cognitive impairment (MCI), and mild AD. Independent component analyses revealed specific memory-related networks that activated or deactivated during an associative memory paradigm. Across all subjects, hippocampal activation and parietal deactivation demonstrated a strong reciprocal relationship. Furthermore, we found evidence of a nonlinear trajectory of fMRI activation across the continuum of impairment. Less impaired MCI subjects showed paradoxical hyperactivation in the hippocampus compared with controls, whereas more impaired MCI subjects demonstrated significant hypoactivation, similar to the levels observed in the mild AD subjects. We found a remarkably parallel curve in the pattern of memory-related deactivation in medial and lateral parietal regions with greater deactivation in less-impaired MCI and loss of deactivation in more impaired MCI and mild AD subjects. Interestingly, the failure of deactivation in these regions was also associated with increased positive activity in a neocortical attentional network in MCI and AD. Our findings suggest that loss of functional integrity of the hippocampal-based memory systems is directly related to alterations of neural activity in parietal regions seen over the course of MCI and AD. These data may also provide functional evidence of the interaction between neocortical and medial temporal lobe pathology in early AD.


Figures

Figure 1.
Figure 1.
Analysis methods diagram. Visual representation of the analysis methods are depicted in a flow chart. a, Starting at the top, 20 ICs were extracted from each group's fMRI dataset. b, The components were then sorted on the basis of the multiple regression of each component's time course with the timing of stimulus paradigm. c, ICs of interest were generated by first averaging within subject, across all six runs, to create individual subject component maps. d–f, The individual subject data were then entered into SPM2 random-effects analyses one-sample (d) and two-sample (e) t tests, as well as multiple regression models which tested the nonlinear relationship across all four groups (f). g, The SPM design matrix visually represents the model that was tested across all four subject groups for each IC of interest. The design matrix is labeled by group and covariate [3, NC; 4, low-SB MCI; 2, high-SB MCI; 1, AD] that corresponds to each group.
Figure 2.
Figure 2.
ICA-derived Pos-TRC. Sagittal and axial slices, display the spatial pattern of Pos-TRC activity across groups (p < 0.01). Sagittal and axial slices are overlaid on the SPM2 single subject T1 template. The left hemisphere is displayed on the left. The colorscale represents the resultant T scores from testing whether the component's voxels indicate percent signal change similarly to the deviations present in the estimated time course. Neuroanatomic regions involved in this component include the hippocampus, bilateral inferior frontal, fusiform, and visual association cortices. Time courses represent the temporal profile of each component across group (black) overlaid on the paradigm “box-car” design (red), demonstrating the degree of task-relatedness of the Pos-TRC component [NC, R2 = 0.866; low-SBMCI, R2 = 0.915; high-SB MCI, R2 = 0.870; AD, R2 = 0.891(p < 0.000001)].
Figure 3.
Figure 3.
ICA-derived Neg-TRC. Sagittal slices and lateral renderings display the spatial pattern of the Neg-TRC activity across groups (p < 0.01). Sagittal slices are overlaid on the SPM2 single subject T1 template, and the renderings were generated using the standard SPM rendering matrix. The left hemisphere is displayed on the left. The colorscale represents T scores of sagittal slices. Neuroanatomic regions most consistently observed across group included precuneus, posterior cingulate, bilateral parietal and temporal regions, anterior cingulate, and superior frontal gyrus.
Figure 4.
Figure 4.
Relationship between activation and deactivation within the task-related component. Scatterplot illustrates the association of Pos-TRC bilateral hippocampal activity with the extent of Neg-TRC bilateral parietal activity (Pearson's r = −0.896; p < 0.0001). The red dotted line represents the linear fit of this data. Note that the extent of deactivation is represented as a negative number, connoting a decrease in MR activity during task.
Figure 5.
Figure 5.
Nonlinear trajectory within the task-related component. Sagittal, coronal, and axial slices through the brain display the regions with the strongest positive relationship to the multiple regression model tested (p < 0.001). a, Within the Pos-TRC, these regions include the left and right hippocampal formation, left and right inferior frontal gyrus, left cingulate gyrus, as well as the right dorsolateral prefrontal cortex. b, Within the Neg-TRC, the regions with the strongest positive relationship to the multiple regression model include the left anterior and posterior cingulate, the precuneus, as well as right and left lateral parietal cortex. (Note that the same regression model is tested in both a and b, and the colormap difference is a function of relationship of the regions to temporal time course of the paradigm.) c, d, Bar graphs display the nonlinear trajectory observed across groups as measured by voxel counts (error bars indicate SE) within the bilateral hippocampus within the Pos-TRC as well as the bilateral parietal regions within the Neg-TRC. Both ROI showed significant differences between all groups (p < 0.0001).
Figure 6.
Figure 6.
Pos-TRC ROI analysis. Bar graphs display the results from the ROI voxel count analyses (+SE). a, Low-SB MCI (L-MCI) subjects demonstrated hyperactivation within the bilateral inferior frontal ROI, supporting the theory of a nonlinear trajectory over the course of preclinical AD. All groups were significantly different (p < 0.0001). b, The bilateral fusiform ROI did not appear to be a region sensitive to hyperactivation. All between-group differences were significant within both ROIs (p < 0.0001), except for the difference between NC and low-SB MCI subjects within the fusiform ROI (p = 0.73).
Figure 7.
Figure 7.
Within-group Sec-C. Axial slices display positive activity within the Sec-C (p < 0.01). The left hemisphere is displayed on the left. The colorscale represents T scores of the significance of each voxel contributing to the overall temporal component. It is important to note that although this is positive activity relative to the temporal pattern of Sec-C, this component does not represent activation as commonly described in relation to task-related activity, as there is little evidence of signal change that is time-linked to the paradigm. Although this component was not clearly task related in terms of relationship to the paradigm timing, there was evidence of sustained positive activity that was spatially consistent across the normal control, low-SB MCI, and high-SB MCI groups, however the AD patients lack the lateral and medial frontal positive activity seen in the other groups.

Similar articles

Cited by

References

    1. Albert MS, Moss MB, Tanzi R, Jones K. Preclinical prediction of AD using neuropsychological tests. J Int Neuropsychol Soc. 2001;7:631–639. - PubMed
    1. Bassett SS, Yousem DM, Cristinzio C, Kusevic I, Yassa MA, Caffo BS, Zeger SL. Familial risk for Alzheimer's disease alters fMRI activation patterns. Brain. 2006;129:1229–1239. - PMC - PubMed
    1. Bell AJ, Sejnowski TJ. An information-maximization approach to blind separation and blind deconvolution. Neural Comput. 1995;7:1129–1159. - PubMed
    1. Bondi MW, Houston WS, Eyler LT, Brown GG. fMRI evidence of compensatory mechanisms in older adults at genetic risk for Alzheimer disease. Neurology. 2005;64:501–508. - PMC - PubMed
    1. Bookheimer SY, Strojwas MH, Cohen MS, Saunders AM, Pericak-Vance MA, Mazziotta JC, Small GW. Patterns of brain activation in people at risk for Alzheimer's disease. N Engl J Med. 2000;343:450–456. - PMC - PubMed

Publication types