Comparative Study
. 2006 Oct 4;26(40):10253-69.
doi: 10.1523/JNEUROSCI.2596-06.2006.

M-like K+ currents in type I hair cells and calyx afferent endings of the developing rat utricle

Affiliations
Comparative Study

M-like K+ currents in type I hair cells and calyx afferent endings of the developing rat utricle

Karen M Hurley et al. J Neurosci. .

Abstract

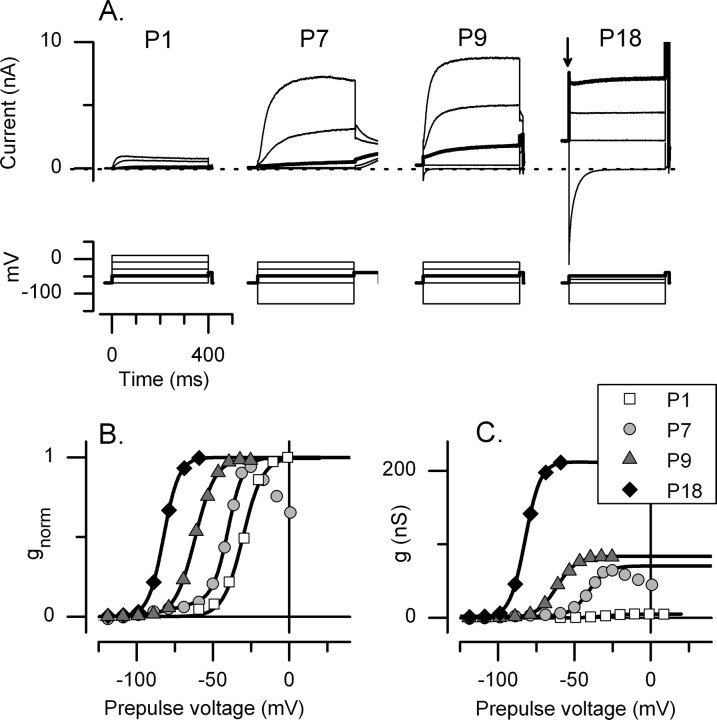
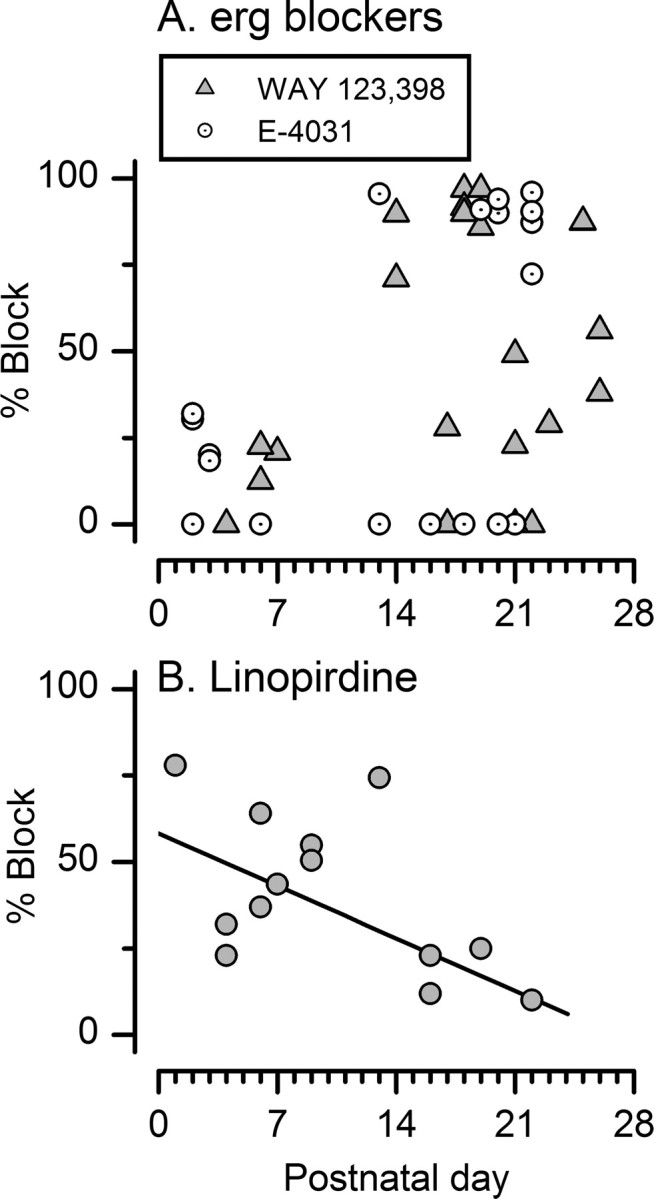
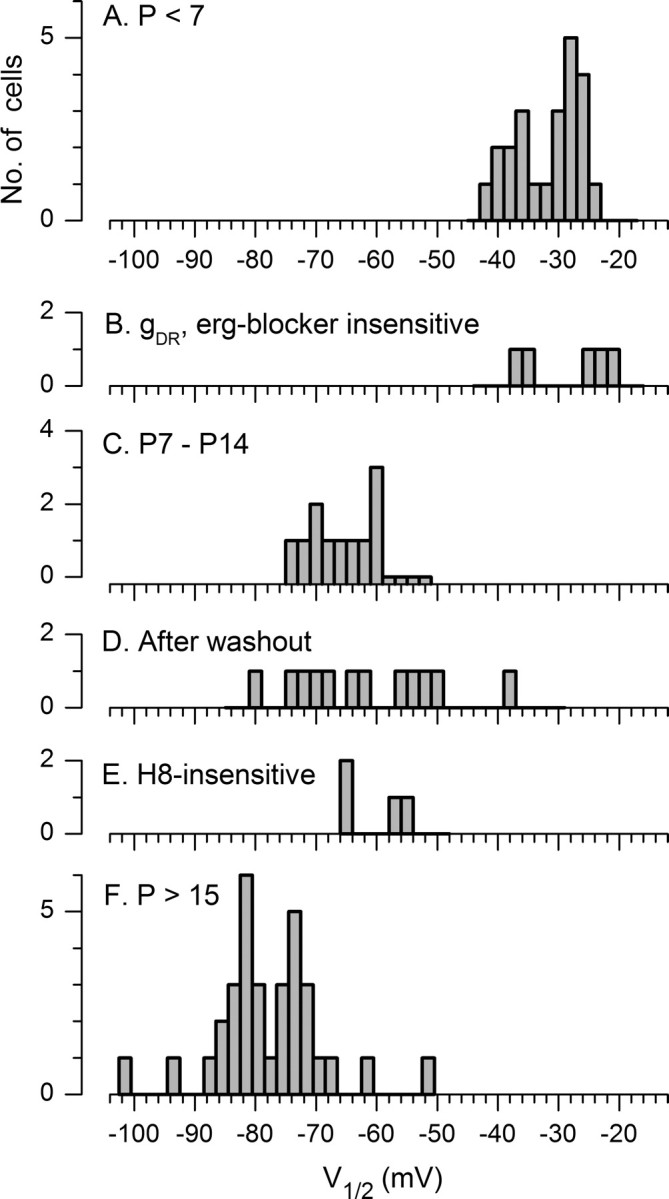
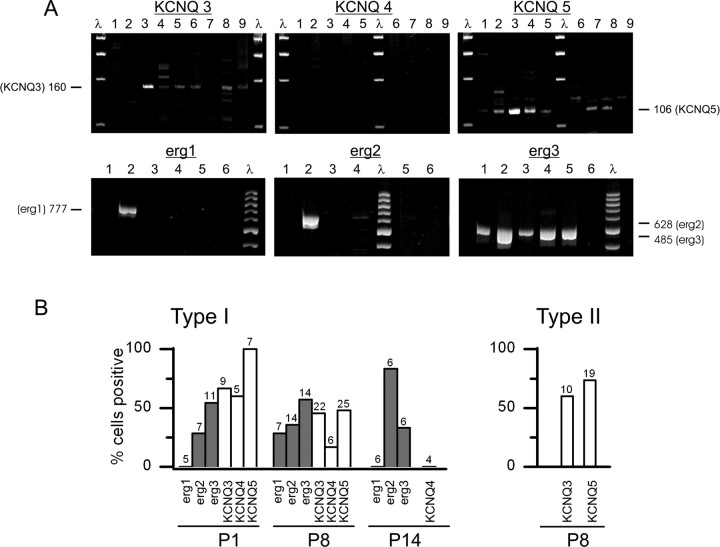
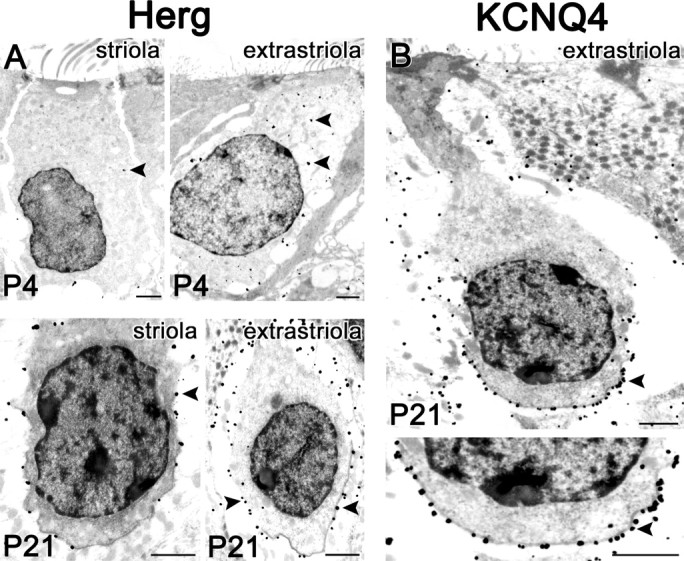
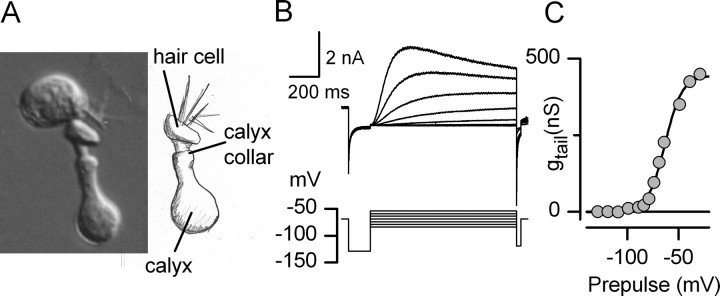
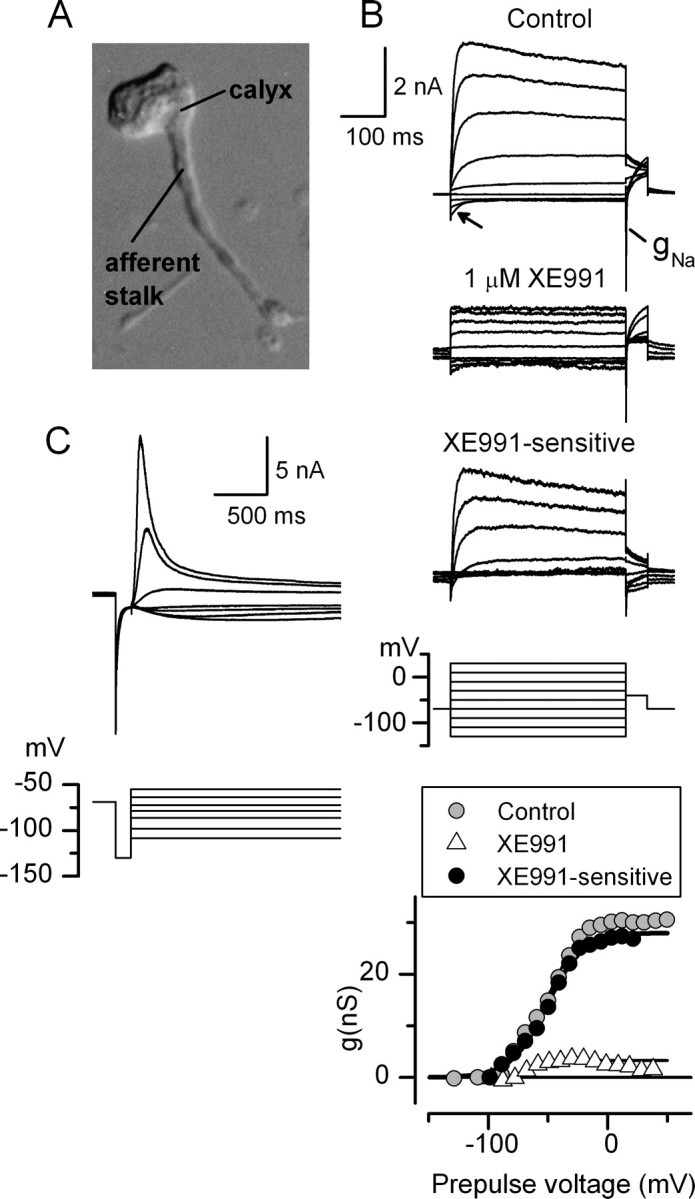
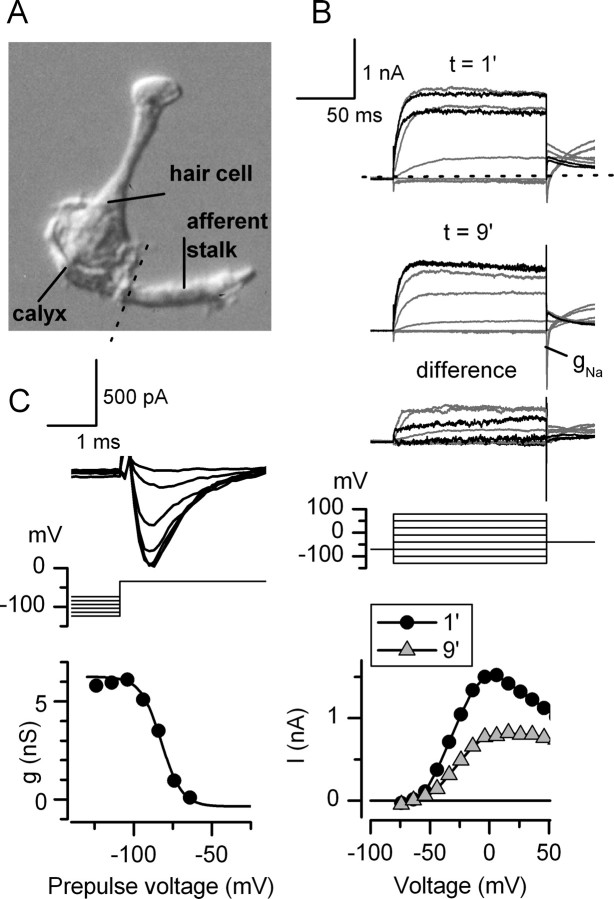
Type I vestibular hair cells have large K+ currents that, like neuronal M currents, activate negative to resting potential and are modulatable. In rodents, these currents are acquired postnatally. In perforated-patch recordings from rat utricular hair cells, immature hair cells [younger than postnatal day 7 (P7)] had a steady-state K+ conductance (g(-30)) with a half-activation voltage (V1/2) of -30 mV. The size and activation range did not change in maturing type II cells, but, by P16, type I cells had added a K conductance that was on average fourfold larger and activated much more negatively. This conductance may comprise two components: g(-60) (V1/2 of -60 mV) and g(-80) (V1/2 of -80 mV). g(-80) washed out during ruptured patch recordings and was blocked by a protein kinase inhibitor. M currents can include contributions from KCNQ and ether-a-go-go-related (erg) channels. KCNQ and erg channel blockers both affected the K+ currents of type I cells, with KCNQ blockers being more potent at younger than P7 and erg blockers more potent at older than P16. Single-cell reverse transcription-PCR and immunocytochemistry showed expression of KCNQ and erg subunits. We propose that KCNQ channels contribute to g(-30) and g(-60) and erg subunits contribute to g(-80). Type I hair cells are contacted by calyceal afferent endings. Recordings from dissociated calyces and afferent endings revealed large K+ conductances, including a KCNQ conductance. Calyx endings were strongly labeled by KCNQ4 and erg1 antisera. Thus, both hair cells and calyx endings have large M-like K+ conductances with the potential to control the gain of transmission.


Figures

Figure 1.
Figure 1.
Changes in outwardly rectifying K conductances of rat utricular hair cells during the first postnatal month. A, Currents evoked by voltage protocols (bottom) from type I hair cells at the postnatal ages shown. VH of −69 mV. Potential at step offset (tail potential) of −39 mV. Maximal outward currents and onset currents (at the step from VH; see arrow in P18 panel) increased with age. Voltage protocols overlap but are not identical across cells because they were designed to cover most of the voltage activation range for each cell (see B). Voltage commands (in millivolts): P1, −69, −49, −29, −9, 11; P7 and P9, −129, −69, −49, −29, −9; and P18, −129, −69, −59, −49. The trace at −49 mV in each panel has been bolded to allow comparison across cells. B, C, Normalized and non-normalized activation curves for the cells in A, fit with single Boltzmann functions (Eq. 1). For the cells P7–P18, the curves were generated from tail currents after 3 s voltage steps (illustrated in Fig. 3). V1/2, S, and gmax values are as follows: P1, −29 mV, 6.0 mV, 5 nS; P7, −40 mV, 5.3 mV, 68 nS; P9, −62 mV, 6.6 mV, 83 nS; P18, −82 mV, 5.0 mV, 210 nS.
Figure 2.
Figure 2.
Voltage activation parameters of K+ conductances in type I cells, but not type II cells, changed as a function of postnatal day. Data from 86 morphologically identified type I cells, 26 morphologically identified type II cells, and six unclassified cells from the first week. Type II and unclassified cells were pooled (black triangles). Boltzmann parameters V1/2 (A), S (B), and gmax at the tail potential of −39 mV (C) from single Boltzmann fits of activation curves generated from tail currents after 3 s protocols (as shown in Fig. 3). Legend in B applies to A and C also. Gray circles, Morphologically identified type I cells. Red circles and error bars, Mean ± SEM of type I data for each day. A, V1/2 versus age. Mean V1/2 for all 19 cells younger than P7, −31.8 ± 1.27 mV. Type II hair cells did not change systematically with age; mean V1/2 for type II cells at P > 6, −30 ± 1.3 mV (n = 26). V1/2 of type I hair cells got more negative throughout the second postnatal week, stabilizing after P15 (red circles indicate daily means) at a mean value of −76 ± 2.1 mV (n = 34). Gray grid lines mark off P7 and P15 and V1/2 values of −30, −60, and −80 mV, which may be the values for three K outward rectifiers (g−30, g−60, and g−80 mV) in type I cells, as discussed in Results. B, S versus age. Mean S for P < 7, 7.8 ± 0.69 mV (19 cells). Mean S for type II cells (P > 6), 7.4 ± 0.49 mV (26 cells). For P > 18, S values of type I cells settled down to 5.6 ± 0.41 mV (17 cells). C, gmax versus age. Mean gmax for P < 7, 28 ± 4.9 nS (19 cells). Mean gmax for type II cells older than P6, 19 ± 2.9 nS (26 cells). During the second week, the type I conductance began to grow, with some examples exceeding 200 nS; mean gmax for type I cells (P > 15), 124 ± 15.9 nS (34 cells).
Figure 3.
Figure 3.
Heterogeneous whole-cell currents from type I cells in the third postnatal week are consistent with more than one negatively activating conductance. Currents from a P17 (A) and a P15 (B) cell. Scale bars in A apply to B. Traces on the right show tail currents on an expanded time scale (20 ms). C, Activation curves generated from tail currents (A, B, insets) and additional traces. Tail potentials, −59 mV (A) and −39 mV (B). The P15 cell (B) had a broader activation range that was better fit with the sum of two Boltzmann functions (Eq. 2) than with a single Boltzmann function (Eq. 1). Fit parameters are as follows: A (single Boltzmann function, shown), V1/2 of −87 mV, S of 5.3 mV; B (single Boltzmann function, not shown) V1/2 of −75 mV, S of 11.6 mV; B (double Boltzmann, shown), V1 of −83 mV, S1 of 6.0 mV, fractional amplitude (A1) of 0.65; V2 of −60 mV, S2 of 4.0 mV, A2 of 0.35.
Figure 4.
Figure 4.
A very negative component of the total K conductance washed out during ruptured-patch recordings, leaving a more positive component. A, P14 type I cell. Initial activation curve, V1/2, S, and gmax of −70 mV, 7.4 mV, 76 nS. At 10 min later, the curve (not shown) was best fit with the sum of two Boltzmann functions (V1 of −82 mV, S1 of 2 mV; V2 of −58 mV; S2 of 6 mV). At 22 min, the activation curve was well fit by a single more positive Boltzmann function: V1/2, S, gmax of −56 mV, 7 mV, 57 nS. This component was stable for the rest of the recording. For the washed-out component (“difference”), V1/2, S, gmax were −80 mV, 5 mV, 47 nS, and the conductance turned over positive to −70 mV. B, Triangles, Time-dependent shift in V1/2 in 12 type I hair cells plotted against initial V1/2. Shifts were measured over intervals varying from 5 to 32 min. A linear regression of points with initial V1/2 values negative to −60 mV (line) had a slope of −1.1 mV/mV and an x-intercept of −67 mV; for more positive initial V1/2 values, no systematic shift was seen. The influence of initial V1/2 is shown by the two cells marked by black triangles. For each of these cells, the time between recordings was 5 min, but only the cell with the more negative activation curve experienced a shift. No shifts were seen for type II hair cells (open circles). C, In the perforated-patch configuration, the activation range for both type I and type II cells was stable. V1/2 for type I cells varied widely because data from young cells were included (see Fig. 2A).
Figure 5.
Figure 5.
A, The broad-spectrum protein kinase inhibitor H8 blocked the more negatively activating component of K+ current. Perforated-patch currents from a P15 type I hair cell. External application of 15 μm H8 reversibly blocked the conductance at the holding potential, gHP of −69 mV (arrows). The H8-sensitive (Control, H8) traces at large depolarizations crossed over those at smaller depolarizations, a pattern typical of erg channels (see C and Results). B, Activation curves from tail currents show that the H8-sensitive conductance was the most negative part of the total conductance and turned over at higher voltages, as seen in erg activation curves. V1/2, S, and gmax values from single Boltzmann fits: Control, −65 mV, 7.6 mV, 49 nS; H8, −51 mV, 7.7 mV, 35 nS; H8-sensitive, −70 mV, 5.9 mV, 28 nS. C, K+ current from a different type I cell; control solutions. The current evoked by a voltage command to +73 mV (black current and voltage traces) inactivates and crosses over current traces at lower depolarizations (gray traces), resembling erg currents.
Figure 6.
Figure 6.
Effects of KCNQ channel blockers on the currents in type I cells at different ages. A, The KCNQ blocker linopirdine (10 μm) reversibly reduced gmax of the K current in a P6 type I cell by 43% without affecting V1/2 (V1/2, S, and gmax values: Control, −29 mV, 7.1 mV, 9.1 nS; Linopirdine-sensitive, −29 mV, 6.1 mV, 4.2 nS; Linopirdine-insensitive, −27 mV, 9.0 mV, 5.1 nS). B, The KCNQ blocker XE991 (10 μm) blocked most of the current in a P13 type I hair cell (control V1/2, S, gmax values, −58 mV, 8.8 mV, 47 nS). The residual current appears to be leak, in that the tail current activation curve was completely blocked. We do not show the activation curves because short voltage steps do not produce an accurate activation curve (Wong et al., 2004). C, In a P16 type I cell with a large negative conductance, linopirdine (10 μm) blocked 23% of the current evoked at the onset of steps from the holding potential, −69 mV (23% of gHP).
Figure 7.
Figure 7.
Effects of erg channel blockers on the currents in type I cells at different ages. A, In a P2 cell, 10 μm E-4031 blocked gmax 32%, the largest effect seen in young cells. Bottom, Tail current activation curves for the data traces shown above and other traces from the same experiment that were omitted for clarity. V1/2, S, and gmax values are as follows: Control, −31 mV, 5.9 mV, 42 nS; E-4031-sensitive, −34 mV, 6.1 mV, 12 nS; E-4031-insensitive, −27 mV, 7.3 mV, 29 nS. B, In a P16 cell, 10 μm E-4031 blocked gHP 98% and the maximum tail current by 33%. The control activation curve (from tail currents) was best fit with the sum of two Boltzmann functions: V1 of −82 mV, S1 of 5.0 mV, gmax1 of 101 nS, V2 of −64 mV, S2 of 3.0 mV; gmax2 of 48 nS. The tail current activation curves for the E-4031-sensitive and E-4031-insensitive currents were fit with single Boltzmann functions with values similar to those of the two Boltzmann functions summed in the control curve; V1/2, S, and gmax values of −83 mV, 4.3 mV, and 94 nS and −63 mV, 1.9 mV, and 95 nS, respectively. C, In a P18 type I hair cell with a very large negative conductance, 10 μm WAY-123,398 reversibly blocked gHP by 97% (D). E, The WAY-123,398-insensitive current had an activation curve with V1/2, S, and gmax values of −46 mV, 7.1 mV, and 69 nS.
Figure 8.
Figure 8.
The effectiveness of erg (A) and KCNQ (B) blockers on type I negatively activating current varied with age. For young cells (P < 10), which lack a significant gHP, we show percentage block of gmax. For older cells with the negative conductance (P > 12), we show percentage block of gHP. A, In the first week, 10 μm WAY-123,398 and 10 μm E-4031 blocked gmax by 0% (3 cells) or 20–30% (7 cells). For P > 12, strong erg blocker effects (74–97%) were seen in more than half of the cells (17 of 31). The percentage showing no effect (26%, 8 of 31) was similar to that in the first week (30%). B, For P < 9, 10 μm linopirdine blocked gmax by 48 ± 6.3% (n = 8). For P > 15, 10 μm linopirdine blocked gHP by 18 ± 3.8% (4 cells).
Figure 9.
Figure 9.
V1/2 values clustered into three bands. For A, the K+ conductance for all cells at P < 7, and, for B, the conductance left behind after strong block of the negative conductance by erg blockers (P > 13), most values were between −20 and −40 mV. For C, the K+ conductance for type I cells in the second week, and the conductance left behind after washout during ruptured-patch recordings (D) or H8 (E), most values were between −50 and −75 mV. For F, the K+ conductance for type I cells older than P15, most values were between −70 and −90 mV.
Figure 10.
Figure 10.
RT-PCR on single cells revealed widespread expression of KCNQ and erg subunits. A, Agarose gels showing PCR products from P8 rat utricular hair cells for KCNQ3, KCNQ4, and KCNQ5 (top) and erg1, erg2, and erg3 (bottom). Top, Nine type I hair cells from one macula were probed for KCNQ3–KCNQ5. Six cells (3, 4, 5, 6, 8, 9) were positive for KCNQ3 (160 bp). Seven cells (1, 2, 3, 4, 5, 7, 8) were positive for KCNQ5 (106 bp). The band for cell 1 was faint. The identities of products at other molecular weights are not known. None were positive for KCNQ4 (380 bp). Bottom, Six type I hair cells from another macula were probed for erg1, erg2, and erg3. Cell 2 was positive for all three subunits, cell 4 was positive for erg2 and erg3 (the band corresponding to erg2 is faint), and five of six cells (cells 1–5) were positive for erg3. B, Percentages of positive PCR products for the following: left, single type I hair cells tested with erg1, erg2, erg3, KCNQ3, KCNQ4, and KCNQ5 probes at P1 and P8, and with erg1, erg2, erg 3, and KCNQ4 probes at P14; right, single type II cells tested with KCNQ3 and KCNQ5 probes at P8. We did not test type II cells at other ages, nor did we test them for KCNQ4 at any age. The number of cells tested in each condition is given at the top of the histogram bars.
Figure 11.
Figure 11.
Staining with antisera against KCNQ subunits and against herg and erg1 showed changes in both hair cell and afferent immunoreactivity with development. Sections of utricular maculae at P0, P4–P8, and P21 were viewed with confocal microscopy. Each row shows results with a different antiserum; age increases from left to right. Each result is shown as a pair: in the top of each pair is the red label of the ion channel antiserum, and in the bottom, the green calretinin label (Cal) is shown in combination with the ion channel antiserum. Scale bar in top left (10 μm) applies to all panels. White symbols in each panel point to examples of the different cell types or staining patterns. A, KCNQ3-like immunoreactivity was present in hair cells at all ages (filled triangles) and not in calyceal endings (open arrows, P6 and P21). B, KCNQ4-like immunoreactivity was present in hair cells at P0 and P6 (triangles) and in calyceal endings (arrows) from P6 to P21. At P21, type I hair cells showed intense bands cupping their bases (arrows) but no cytoplasmic staining, whereas a few type II hair cells had cytoplasmic staining (filled triangles). Cups were biggest in the striola (s). C, KCNQ5-like immunoreactivity was present in hair cells (triangles) and supporting cells (open triangles) at all ages and in calyceal afferents (arrows). D, herg-like immunoreactivity: punctate staining of hair cells at P0 became more uniform with age (triangles). From P4 on, label was also seen on maturing calyces (arrows; see growing cups around green hair cells in the double-labeled panel at P4 and more extensive staining at P21). By P21, staining was especially strong in the extrastriola (e). E, erg1-like immunoreactivity: staining appeared more concentrated on afferent endings than on hair cells. Even at P0, staining formed cups at the bases of hair cells, which do not overlap with the cytoplasmic calretinin stain of the hair cells. This putative afferent staining increased in intensity with age. There was also some cytoplasmic stain in hair cells, especially at P21 (triangle points to a stained type II cell).
Figure 12.
Figure 12.
Electron microscopy localizes much of the herg-like and KCNQ4-like immunoreactivity to the calyces. Silver-enhanced immunogold method; black spots are silver grains. Scale bars, 1 μm. A, herg-like-immunoreactivity at P4 and P21. At P4, label within hair cells (arrowheads) is relatively sparse, with more grains in the extrastriolar cell. At P21 (bottom row), calyces are seen as white spaces with mitochondria around the hair cells; mainly the inner face of the calyx is visible around the striolar cell (left). At this age, staining is localized to both inner and outer faces of the calyx (see extrastriolar calyx) and is more abundant in the extrastriola. Arrowhead points to grains on the calyx inner face. B, KCNQ4-like immunoreactivity at P21 in a type I cell in a simple extrastriolar calyx. Silver grains are most abundant on the calyx inner face membrane (see higher magnification below; arrowhead points to grains on the calyx inner face), accounting for the bright lines of stain cupping the basal membrane of the hair cells in confocal fluorescent images (Fig. 11). Relatively few silver grains are in the hair cell side of the synaptic cleft (3 of 41 grains near the inner-face membrane in the high-magnification view).
Figure 13.
Figure 13.
Whole-cell perforated-patch recording from a calyx on an isolated hair cell revealed a huge negatively activating conductance. A, Photomicrograph and drawing showing a P17 hair cell with its calyx still surrounding the hair cell. B, Currents evoked by steps between −80 and −50 mV. C, Activation curve constructed from the tail currents shown in B and, for potentials positive to −60 mV, from a shorter protocol (100 ms voltage steps; not shown). V1/2, S, gmax, −63 mV, 8.4 mV, 428 nS (calculated using the observed reversal potential of −82 mV).
Figure 14.
Figure 14.
Whole-cell perforated-patch recording from calyces and attached afferent stalks revealed large K+ and Na+ conductances. A, Photomicrograph showing a calyx and attached afferent stalk isolated from its hair cell; P21. B, Whole-cell currents recorded from the calyx in A deactivated during hyperpolarizations (arrow). A transient inward current, presumably through an Na+ conductance, gNa, was evoked by steps from potentials negative to −79 mV to the tail potential of −39 mV. XE991 at 1 μm blocked most of the outward current (see difference current). Bottom, Tail current activation curves fitted with Boltzmann functions. V1/2, S, gmax values are as follows: control current, −52 mV, 15.9 mV, 30 nS; XE991-sensitive component, −51 mV, 14.6 mV, 27 nS; XE991-insensitive component, −64 mV, 5 mV, 4 nS. C, Whole-cell perforated-patch recording from a different calyx and attached stalk, isolated from a crista; P19. This afferent had a very large current that activated positive to −100 mV, reversed at EK (−85 mV), and inactivated strongly for steps positive to −70 mV.
Figure 15.
Figure 15.
Voltage-gated currents in a calyceal afferent stalk included a Na+ current and a probable Ca2+-dependent K+ current. A, The P26 hair cell, calyx, and afferent stalk before recording. After we formed a tight seal on the stalk, it detached from the calyx (dotted line). We recorded in ruptured-patch mode with standard solutions. B, Currents recorded 1 min after breakthrough, 9 min after breakthrough, and the difference. By 9 min, the outward current was smaller (washout) and the fast inward current at the offset of very negative steps (gNa) was larger (wash-in). Bottom, Steady-state I–V relationships from traces in B and other traces. At 1 min, the current declined at high depolarizations. By 9 min, the current was smaller and did not turn over. C, The voltage dependence of inactivation of gNa. Top, Fast transient inward currents (INa) activated by depolarization to −34 mV decreased as prepulses became less hyperpolarized (middle). Bottom, Inactivation curve generated from the data in the top. Boltzmann parameters are as follows: V1/2 of −82 mV, S of 5.7 mV, gmax of 6.4 nS.

Similar articles

Cited by

References

    1. Anantharam A, Markowitz SM, Abbott GW. Pharmacogenetic considerations in diseases of cardiac ion channels. J Pharmacol Exp Ther. 2003;307:831–838. - PubMed
    1. Barry PH. JPCalc, a software package for calculating liquid junction potential corrections in patch-clamp, intracellular, epithelial and bilayer measurements and for correcting junction potential measurements. J Neurosci Methods. 1994;51:107–116. - PubMed
    1. Brichta AM, Aubert A, Eatock RA, Goldberg JM. Regional analysis of whole cell currents from hair cells of the turtle posterior crista. J Neurophysiol. 2002;88:3259–3278. - PubMed
    1. Brown AM. hERG block, QT liability and sudden cardiac death. In: Chadwick DJ, Goode J, editors. The hERG cardiac potassium channel: structure, function and Long QT syndrome. Chichester, UK: Wiley; 2005. pp. 118–135. - PubMed
    1. Brown DA, Adams PR. Muscarinic suppression of a novel voltage-sensitive K+ current in a vertebrate neurone. Nature. 1980;283:673–676. - PubMed

Publication types

MeSH terms

LinkOut - more resources