Comparative Study
. 2006 Oct 4;26(40):10315-26.
doi: 10.1523/JNEUROSCI.2395-06.2006.

Functional role of GABAergic innervation of the cochlea: phenotypic analysis of mice lacking GABA(A) receptor subunits alpha 1, alpha 2, alpha 5, alpha 6, beta 2, beta 3, or delta

Affiliations
Comparative Study

Functional role of GABAergic innervation of the cochlea: phenotypic analysis of mice lacking GABA(A) receptor subunits alpha 1, alpha 2, alpha 5, alpha 6, beta 2, beta 3, or delta

Stéphane F Maison et al. J Neurosci. .

Abstract

The olivocochlear efferent system is both cholinergic and GABAergic and innervates sensory cells and sensory neurons of the inner ear. Cholinergic effects on cochlear sensory cells are well characterized, both in vivo and in vitro; however, the robust GABAergic innervation is poorly understood. To explore the functional roles of GABA in the inner ear, we characterized the cochlear phenotype of seven mouse lines with targeted deletion of a GABA(A) receptor subunit (alpha1, alpha2, alpha5, alpha6, beta2, beta3, or delta). Four of the lines (alpha1, alpha2, alpha6, and delta) were normal: there was no cochlear histopathology, and cochlear responses suggested normal function of hair cells, afferent fibers, and efferent feedback. The other three lines (alpha5, beta2, and beta3) showed threshold elevations indicative of outer hair cell dysfunction. Alpha5 and beta2 lines also showed decreased effects of efferent bundle activation, associated with decreased density of efferent terminals on outer hair cells: although the onset of this degeneration was later in alpha5 (>6 weeks) than beta2 (<6 weeks), both lines shows normal efferent development (up to 3 weeks). Two lines (beta2 and beta3) showed signs of neuropathy, either decreased density of afferent innervation (beta3) or decreased neural responses without concomitant attenuation of hair cell responses (beta2). One of the lines (beta2) showed a clear sexual dimorphism in cochlear phenotype. Results suggest that the GABAergic component of the olivocochlear system contributes to the long-term maintenance of hair cells and neurons in the inner ear.


Figures

Figure 1.
Figure 1.
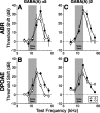
Three GABAA mutant lines, α5, β2, and β3, showed cochlear dysfunction when measured at 6 weeks; in both α5 and β2 lines, threshold shifts in ABR (A–C) and DPOAE (D–F) were even greater at 24 weeks. Group mean ± SEM thresholds for homozygous nulls (open symbols) are compared in each panel with wild-type littermates (filled symbols). Other aspects of symbology are explained in the keys. Upward arrowheads associated with DPOAE threshold more than ∼60 dB indicate that, at these high frequencies, thresholds have reached stimulus levels producing passive distortion in the acoustic system and thus represent underestimates of true cochlear dysfunction.
Figure 2.
Figure 2.
Mean cochlear thresholds in the three GABAA mutant lines with cochlear phenotype (data from Fig. 1) are replotted as threshold shifts by subtracting values obtained in knock-outs from mean values in wild types. A and B show ABR data for 6 and 24 weeks, respectively; C and D show DPOAE data for 6 and 24 weeks, respectively. In E, comparison of ABR shifts and DPOAE shifts in these three lines suggests that the ongoing degeneration in β2 and α5 lines is a type of neuropathy, i.e., ABR shifts ≫ DPOAE shifts. Data in E are shown only for the 16 kHz test frequency: each bar height in this panel is computed by subtracting the ABR shift (A, B) from the DPOAE shift (C, D) for the same mutant at the same group age. The bar labeled NIHL (noise-induced hearing loss) represents the difference between the mean ABR and DPOAE shifts at 16 kHz measured in a large group of CBA/CaJ mice after a noise exposure causing permanent cochlear damage that targets the OHCs (Wang et al., 2002) (S. G. Kujawa and M. C. Liberman, unpublished data).
Figure 3.
Figure 3.
OHC efferent function is diminished in GABAA β2 mutants and unaffected in α5 [and 3 other lines tested (supplemental Fig. S3, available at www.jneurosci.org as supplemental material). Efferent function was assessed by measuring DPOAE suppression caused by efferent-bundle shocks, normalized as described in Materials and Methods. A, B, Group mean ± SEM data for suppression magnitude for each of the six test frequencies in the mutant indicated. Numbers of animals tested in each genotype from each strain are in Table 1. C shows typical data from one run of this assay: DPOAE amplitude was measured 12 times during a ∼70 s period, after which the shock train was turned on. The magnitude of the efferent effect is defined in Materials and Methods.
Figure 4.
Figure 4.
Exposure to high-level noise designed to cause severe, but reversible, threshold shifts does not reveal any differences in cochlear vulnerability attributable to loss of either the α5 or β2 subunits. Group mean ± SEM threshold shifts are shown for ABR and DPOAE measured 12 h after exposure to a 8–16 kHz noise band at 89 dB SPL for 2 h. Threshold shift is defined as the difference between preexposure and postexposure values for the same groups of animals. Group sizes can be extracted from the row labeled “Cochlear vulnerability” in Table 1.
Figure 5.
Figure 5.
At 6–10 weeks, GABAA mutants show minimal cochlear histopathology at the light microscopic level; at >24 weeks, all three strains with threshold elevation show a similar pattern of basal-turn histopathology. Representative cases are illustrated here. Total numbers of cochleas evaluated can be extracted from Table 1. Details of techniques for relating cochlear positions in the sections to cochlear frequency are described in Materials and Methods.
Figure 6.
Figure 6.
Photomicrographs illustrating the cochlear histopathology seen in the GABAA mutant strains with cochlear threshold elevations. The six cases illustrated here show the 30 kHz location from each of the same six cases for which the quantitative analyses are shown in Figure 5. Filled arrows in B–D point to the spiral ligament in which there is degeneration of type IV fibrocytes. The open arrow in D points to a small region of fibrocyte loss in the limbus near the osseous spiral lamina. The numbers above each panel give the age at which each animal was killed. Scale bar in C applies to all images.
Figure 7.
Figure 7.
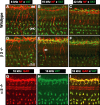
Immunostaining for a cholinergic marker (VAT) and a GABAergic marker (GAD) reveals loss of OHC efferent terminals in the β2 null at 6 weeks (D–F) but not the α5 null (G–I) compared with age-matched controls (A–C). A–F show projections from confocal z-stacks through cochlear whole mounts double stained for VAT (green) and NF-200 (red). Only merged images are shown. In x and y, the images span the organ of Corti from the OHCs to the inner spiral bundle (ISB). In z, the stack spans the region in which efferent terminals are found. Three cochlear regions are shown: 8 kHz (A, D), 16 kHz (B, E), and 32 kHz (C, F). G–I, Double staining for VAT (green, H) and GAD (red, G) shows normal efferent innervation in the 16 kHz region of an α5 null ear and the normal pattern of colocalization of GABAergic and cholinergic markers. Scale bar in D applies to all panels.
Figure 8.
Figure 8.
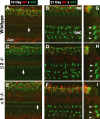
Immunostaining for VAT (green) and NF (red) in developing mice reveals a normal density of OHC efferent terminals at P10 and P21 in both β2 and α5 nulls. A–F, x–y projections from confocal z-stacks through cochlear whole mounts from the 16 kHz region: only merged images are shown. In x and y, the images span the organ of Corti from the OHCs to the inner spiral bundle (ISB). In z, the stack spans the region in which efferent terminals are found. Arrows indicate nascent efferent terminals under first-row OHCs in the P10 images. G–I, y–z projections of the 21 d images. Arrowheads point to the efferent terminal clusters under each of the three rows of OHCs. Scale bar in A applies to all panels.
Figure 9.
Figure 9.
Anti-neurofilament immunostaining reveals a reduction in afferent and efferent innervation of hair cells in the GABAA β3 nulls at 24 weeks. A and D show low-power views from the middle of the cochlea in a wild type and β3 null, respectively. The image is focused at the level of the tunnel of Corti at which efferent axons (open arrows) cross to OHCs. The inner spiral bundle (ISB) contains spiraling efferents in the region under IHCs. Scale bar in D applies to A as well. B and E show high-power (100× objective) z-series projections from selected regions of the same cochlear pieces shown in A and D, respectively. These images constitute the superposition (darkest pixel) of 75 images acquired at 0.5 μm intervals, spanning the focal depths over which fibers cross from the inner spiral bundle to the OHCs, including both thin OHC afferents (filled arrowhead) and thicker OHC efferents (open arrowhead). C and F show the x–z projections of the same image stacks shown in B and E, respectively, first cropped to include only the IHC region (see dashed lines in B and E). This projection reveals immunostained afferent terminals (e.g., open arrowhead in C) contacting the sides of IHCs. Scale bar in E applies to B, C, and F as well.
Figure 10.
Figure 10.
AChE staining shows medial olivocochlear neurons and their proximal dendrites in the superior olivary complex: even at 4 months of age, there is no obvious loss of olivocochlear neurons in the β2 null mutants. Photomicrographs in B and C are taken from the ventral regions of the olivary complex (schematic in A), just rostral to the rostral tip of the lateral superior olivary nuclei, in which the concentration of medial olivocochlear neurons is greatest. Arrows point to AChE-positive cell bodies in each image.
Figure 11.
Figure 11.
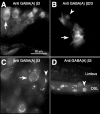
Immunostaining patterns in wild-type ears for GABAA β2 and β3 subunits. A, Outer hair cells stained with an antibody to the GABAA β2 subunit. An OHC from the third row is shown at the arrow. B, Fibers and terminals in the inner spiral bundle area (white arrow) immunostained with an antibody to both β2 and β3 subunits. The arrowhead points to the IHC nucleus. C, Immunolabeling of the perimeter of selected spiral ganglion cells (white arrow) and selected axons (arrowhead) with an antibody to the GABAA β3 subunit. D, Immunolabeling outlines selected peripheral axons in the osseous spiral lamina (OSL) using the same anti-β3 antibody as in C. Scale bar in A applies to all images.

Similar articles

Cited by

References

    1. Arnold T, Oestreicher E, Ehrenberger K, Felix D. GABA(A) receptor modulates the activity of inner hair cell afferents in guinea pig cochlea. Hear Res. 1998;125:147–153. - PubMed
    1. Bao J, Lei D, Du Y, Ohlemiller KK, Beaudet AL, Role LW. Requirement of nicotinic acetylcholine receptor subunit β2 in the maintenance of spiral ganglion neurons during aging. J Neurosci. 2005;25:3041–3045. - PMC - PubMed
    1. Babot Z, Cristofol R, Sunol C. Excitotoxic death induced by released glutamate in depolarized primary cultures of mouse cerebellar granule cells is dependent on GABAA receptors and niflumic acid-sensitive chloride channels. Eur J Neurosci. 2005;21:103–112. - PubMed
    1. Batta TJ, Panyi G, Szucs A, Sziklai I. Regulation of the lateral wall stiffness by acetylcholine and GABA in the outer hair cells of the guinea pig. Eur J Neurosci. 2004;20:3364–3370. - PubMed
    1. Bobbin RP, Bledsoe SC, Jr, Winbery S, Ceasar G, Jenison GL. Comparative actions of GABA and acetylcholine on the Xenopus laevis lateral line. Comp Biochem Physiol C. 1985;80:313–318. - PubMed

Publication types