. 2006;8 Suppl 1(Suppl 1):S29-37.

Contrast-enhanced ultrasound imaging of prostate cancer

Contrast-enhanced ultrasound imaging of prostate cancer

Ethan J Halpern. Rev Urol. 2006.

Abstract

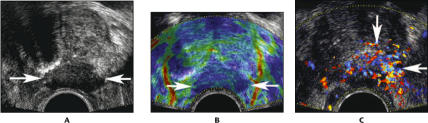
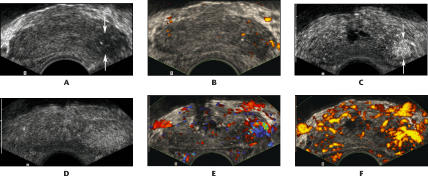
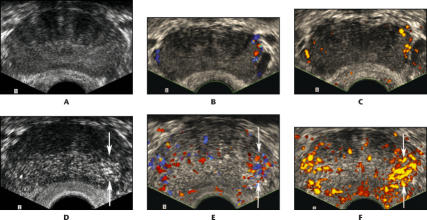
Ultrasound imaging of the prostate is commonly used to assess the size of the gland and for needle placement during systematic biopsy. Ultrasound evaluation of prostate cancer is limited by difficulty in distinguishing benign from malignant tissue. Although Doppler techniques may provide some improvement in the detection of prostate cancer, targeted biopsy based on conventional ultrasound with Doppler is not sufficient to replace systematic biopsy. Contrast-enhanced ultrasound imaging techniques that employ microbubble contrast agents represent an innovative approach to imaging of the neovascularity associated with prostate cancer. This review describes the application of contrast-enhanced ultrasound to improve detection and assessment of prostate cancer.


Figures

Figure 1
Figure 1
An 80-year-old man with biopsy cores demonstrating Gleason 9 and Gleason 10 cancer in the left midgland: transverse images through the midgland of the prostate. A. Conventional gray scale image shows a hypoechoic mass extending exophytically from the prostate (arrows). The hypoechoic appearance is the classic description for prostate cancer. B. Real-time elastography shows reduced tissue elasticity (darker blue color) in the region of the mass (arrows). C. Color Doppler shows increased flow within and around the mass (arrows).
Figure 2
Figure 2
A 75-year-old man with prostate-specific antigen of 5.1 and Gleason 8 cancer in the left base: transverse images through the base of the prostate. A. Conventional gray scale image shows a hypoechoic area in the left base (arrows). B. Power Doppler image shows no significant increase in flow in this hypoechoic area. C. Harmonic gray scale during contrast infusion shows a clearly defined area of focal enhancement, corresponding to the cancer (arrows). D. Harmonic gray scale with intermittent imaging shows a less well-defined, larger area of parenchymal enhancement around the cancer. E. Contrast-enhanced color Doppler image shows increased flow associated with the cancer. F. Contrast-enhanced power Doppler image also shows increased flow associated with the cancer.
Figure 3
Figure 3
A 78-year-old man with prostate-specific antigen of 5.6 and Gleason 8 cancer in the left midgland: transverse images through the midgland of the prostate. A. Conventional gray scale image shows no focal lesion. B. Power Doppler image shows only minimal flow along the left side of the prostate. C. Continuous harmonic gray scale during contrast infusion shows a defined area of focal enhancement, corresponding to the cancer (arrows). D. Harmonic gray scale with intermittent imaging shows the same area of enhancement with better definition. E. Contrast-enhanced color Doppler image shows increased flow on the side of the cancer, but does not localize the lesion as well as the harmonic gray scale. F. Contrast-enhanced power Doppler image also shows increased flow on the side of the cancer.
Figure 4
Figure 4
A 60-year-old man with prostate-specific antigen of 7.4 and Gleason 6 cancer in the left base, found only by targeted biopsy: transverse images through the base of the prostate. A. Conventional gray scale image shows no focal lesion. B. Color Doppler image shows only minimal flow within capsular vessels along the margin of the prostate. C. Power Doppler image shows only minimal flow within capsular vessels along the margin of the prostate. D. Continuous harmonic gray scale during contrast infusion shows a defined area of focal parenchymal enhancement, corresponding to the cancer (arrows). E. Contrast-enhanced color Doppler image shows increased flow, corresponding to the cancer (arrows). F. Contrast-enhanced power Doppler image also shows increased flow corresponding to the cancer (arrows).

References

    1. Jemal A, Murray T, Ward E, et al. Cancer statistics, 2005. CA Cancer J Clin. 2005;55:10–30. - PubMed
    1. McNeal JE. Origin and development of carcinoma in the prostate. Cancer. 1969;23:24–33. - PubMed
    1. McNeal JE, Price HM, Redwine EA, et al. Stage A versus stage B carcinoma of the prostate: morphologic comparison and biologic significance. J Urol. 1988;139:61–65. - PubMed
    1. Byar DP, Mostofi FK. Carcinoma of the prostate: prognostic evaluation of certain pathologic features in 208 radical prostatectomies. Cancer. 1972;30:5–13. - PubMed
    1. McNeal JE, Redwine EA, Freiha FS, Stamey TRA. Zonal distribution of prostatic adenocarcinoma: correlation with histologic pattern and direction of spread. Am J Surg Pathol. 1988;12:897–906. - PubMed

LinkOut - more resources