

Magnetic resonance imaging and spectroscopy of prostate cancer
- PMID: 17021625
- PMCID: PMC1578527
Magnetic resonance imaging and spectroscopy of prostate cancer
Abstract
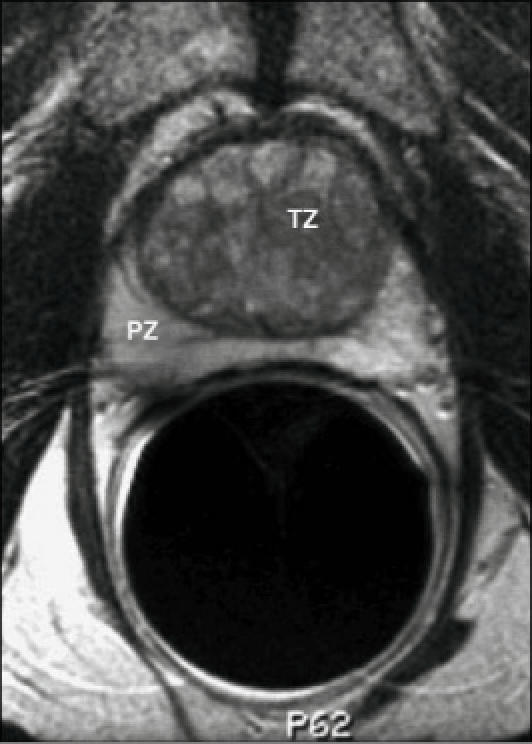
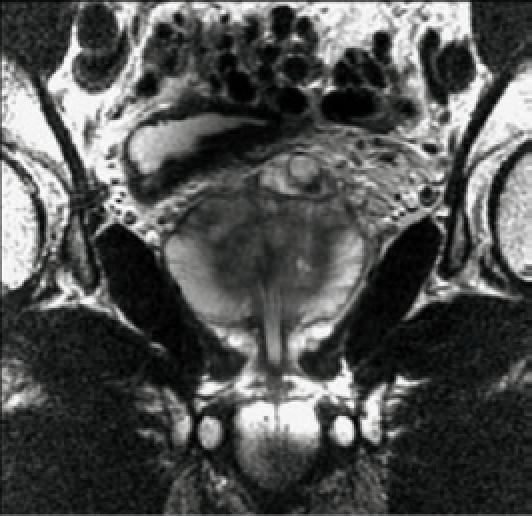
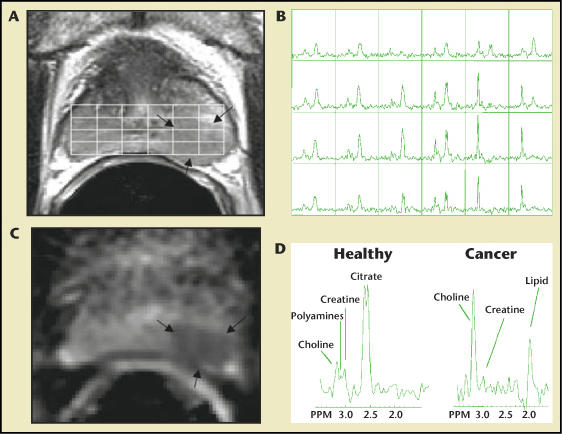
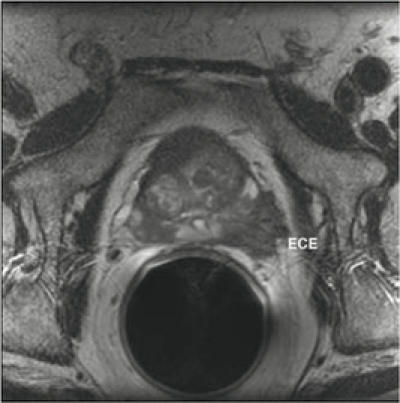
Magnetic resonance imaging may improve the staging of prostate cancer compared with clinical evaluation alone, computerized tomography, or transrectal ultrasound, and it allows simultaneous and detailed evaluation of prostatic, periprostatic, and pelvic anatomy. Endorectal magnetic resonance imaging and magnetic resonance spectroscopic imaging (endoMRI/MRSI) allow better visualization of the zonal anatomy of the prostate and better delineation of tumor location, volume, and extent (stage). Metabolic criteria used to identify and localize prostate cancer with endoMRI/MRSI have been standardized, thus improving the accuracy of the examination and limiting interobserver variations in interpretation. Evidence is now emerging that endoMRI/MRSI may also be helpful in assessing response to prostate cancer treatment, most commonly with radiation and/or androgen-deprivation therapy.
Figures

References
-
- Jemal A, Murray T, Ward E, et al. Cancer statistics, 2005. CA Cancer J Clin. 2005;55:10–30. - PubMed
-
- Cooperberg MR, Lubeck DP, Mehta SS, et al. Time trends in clinical risk stratification for prostate cancer: implications for outcomes (data from CaPSURE) J Urol. 2003;170:S21–25. - PubMed
-
- Cooperberg MR, Moul JW, Carroll PR. The changing face of prostate cancer. J Clin Oncol. 2005;23:8146–8151. - PubMed
-
- Purohit RS, Shinohara K, Meng MV, et al. Imaging clinically localized prostate cancer. Urol Clin North Am. 2003;30:279–293. - PubMed
-
- Wolf JS , Jr, Cher M, Dall’era M, et al. The use and accuracy of cross-sectional imaging and fine needle aspiration cytology for detection of pelvic lymph node metastases before radical prostatectomy. J Urol. 1995;153:993–999. - PubMed
LinkOut - more resources
Full Text Sources
Other Literature Sources