. 2007 Sep;20(3):223-37.
doi: 10.1007/s10278-006-0860-9.

Fractal analysis of contours of breast masses in mammograms

Affiliations

Fractal analysis of contours of breast masses in mammograms

Rangaraj M Rangayyan et al. J Digit Imaging. 2007 Sep.

Abstract

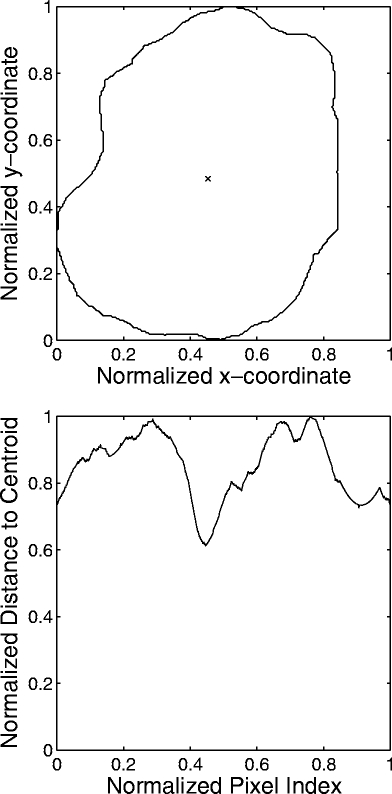
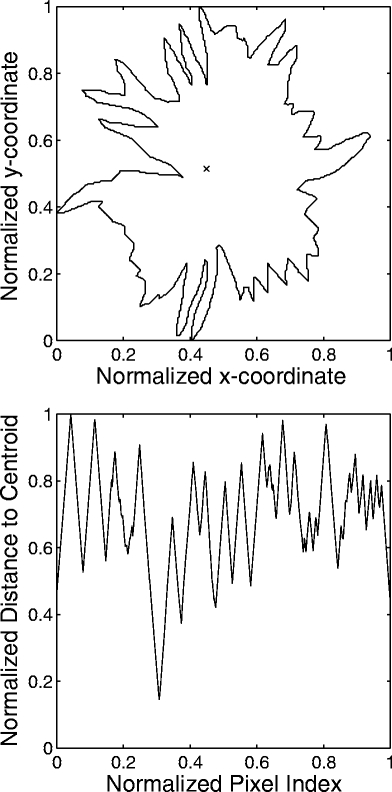
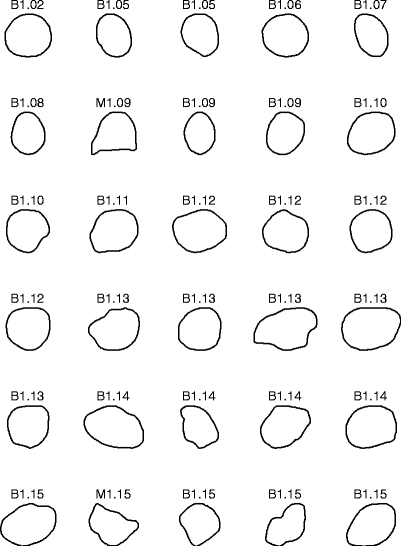
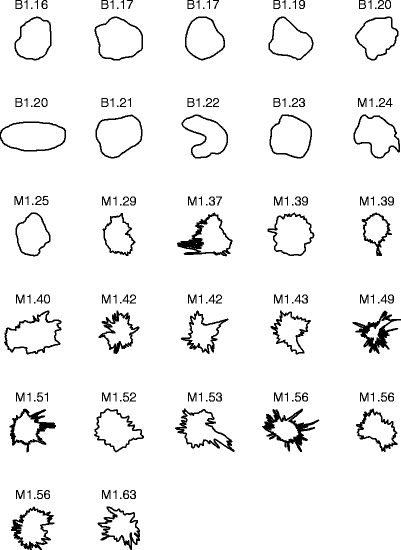
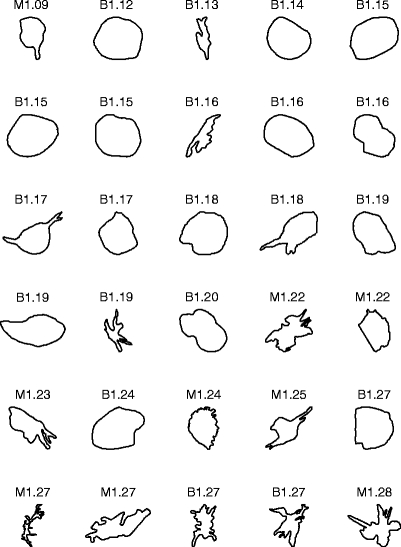
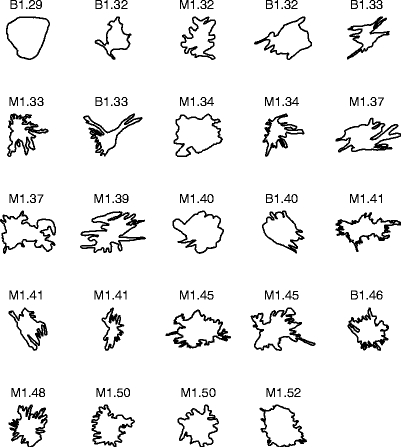
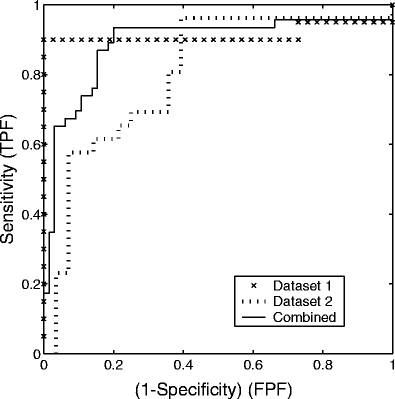
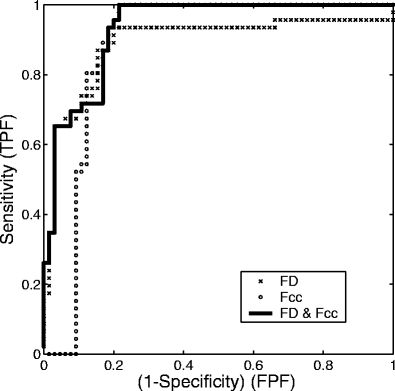
Fractal analysis has been shown to be useful in image processing for characterizing shape and gray-scale complexity. Breast masses present shape and gray-scale characteristics that vary between benign masses and malignant tumors in mammograms. Limited studies have been conducted on the application of fractal analysis specifically for classifying breast masses based on shape. The fractal dimension of the contour of a mass may be computed either directly from the 2-dimensional (2D) contour or from a 1-dimensional (1D) signature derived from the contour. We present a study of four methods to compute the fractal dimension of the contours of breast masses, including the ruler method and the box counting method applied to 1D and 2D representations of the contours. The methods were applied to a data set of 111 contours of breast masses. Receiver operating characteristics (ROC) analysis was performed to assess and compare the performance of fractal dimension and four previously developed shape factors in the classification of breast masses as benign or malignant. Fractal dimension was observed to complement the other shape factors, in particular fractional concavity, in the representation of the complexity of the contours. The combination of fractal dimension with fractional concavity yielded the highest area (A ( z )) under the ROC curve of 0.93; the two measures, on their own, resulted in A ( z ) values of 0.89 and 0.88, respectively.


Figures

Fig 1
Fig 1
Example of the contour of a benign breast mass and the corresponding signature. The × mark indicates the centroid of the contour. The contour and signature have been normalized. FD = 1.16 by the 1D ruler method. FD = 1.02 by the 2D ruler method.
Fig 2
Fig 2
Example of the contour of a malignant breast tumor and the corresponding signature. The × mark indicates the centroid of the contour. The contour and signature have been normalized. FD = 1.42 by the 1D ruler method. FD = 1.45 by the 2D ruler method.
Fig 3
Fig 3
Contours of 37 benign masses and 20 malignant tumors in the first data set, ranked by their FD estimated by the 1D ruler method. The contours are of widely differing size, but have been scaled to the same bounding box in the plots. B: benign; M: malignant.
Fig 3
Fig 3
Contours of 37 benign masses and 20 malignant tumors in the first data set, ranked by their FD estimated by the 1D ruler method. The contours are of widely differing size, but have been scaled to the same bounding box in the plots. B: benign; M: malignant.
Fig 4
Fig 4
Contours of 28 benign masses and 26 malignant tumors in the second data set, ranked by their FD estimated by the 1D ruler method. The contours are of widely differing size, but have been scaled to the same bounding box in the plots. B: benign; M: malignant.
Fig 4
Fig 4
Contours of 28 benign masses and 26 malignant tumors in the second data set, ranked by their FD estimated by the 1D ruler method. The contours are of widely differing size, but have been scaled to the same bounding box in the plots. B: benign; M: malignant.
Fig 5
Fig 5
ROC curves indicating the classification performance of FD obtained by using the 1D ruler method with the first (×), second (dotted line), and combined (solid line) data sets. The area Az under the ROC curves are 0.91, 0.80, and 0.89, respectively. TPF: true-positive fraction; FPF: false-positive fraction.
Fig 6
Fig 6
ROC curves representing the classification performance of FD obtained with the 1D ruler method (×), Fcc (○), and their combination (solid line) with the combined data set. The areas under the three curves are, in order, 0.89, 0.88, and 0.93.

References

    1. Alberta Cancer Board, Alberta, Canada, http://www.cancerboard.ab.ca/screentest. Screen Test: Alberta Program for the Early Detection of Breast Cancer—2001/03 Biennial Report, 2004
    1. Peitgen HO, (ed.) Proceedings of the 6th International Workshop on Digital Mammography, Bremen, Germany, June 2002. Springer-Verlag
    1. Homer MJ. Mammographic Interpretation: A Practical Approach. 2. Boston, MA: McGraw-Hill; 1997.
    1. American College of Radiology, Reston, VA. Illustrated Breast Imaging Reporting and Data System (BI-RADS™), 3rd ed., 1998
    1. Rangayyan RM, El-Faramawy NM, Desautels JEL, Alim OA. Measures of acutance and shape for classification of breast tumors. IEEE Trans Med Imag. 1997;16(6):799–810. doi: 10.1109/42.650876. - DOI - PubMed

Publication types