. 2006 Oct 5:5:41.
doi: 10.1186/1476-4598-5-41.

Overexpression of Eag1 potassium channels in clinical tumours

Affiliations

Overexpression of Eag1 potassium channels in clinical tumours

Bernhard Hemmerlein et al. Mol Cancer. .

Abstract

Background: Certain types of potassium channels (known as Eag1, KCNH1, Kv10.1) are associated with the production of tumours in patients and in animals. We have now studied the expression pattern of the Eag1 channel in a large range of normal and tumour tissues from different collections utilising molecular biological and immunohistochemical techniques.

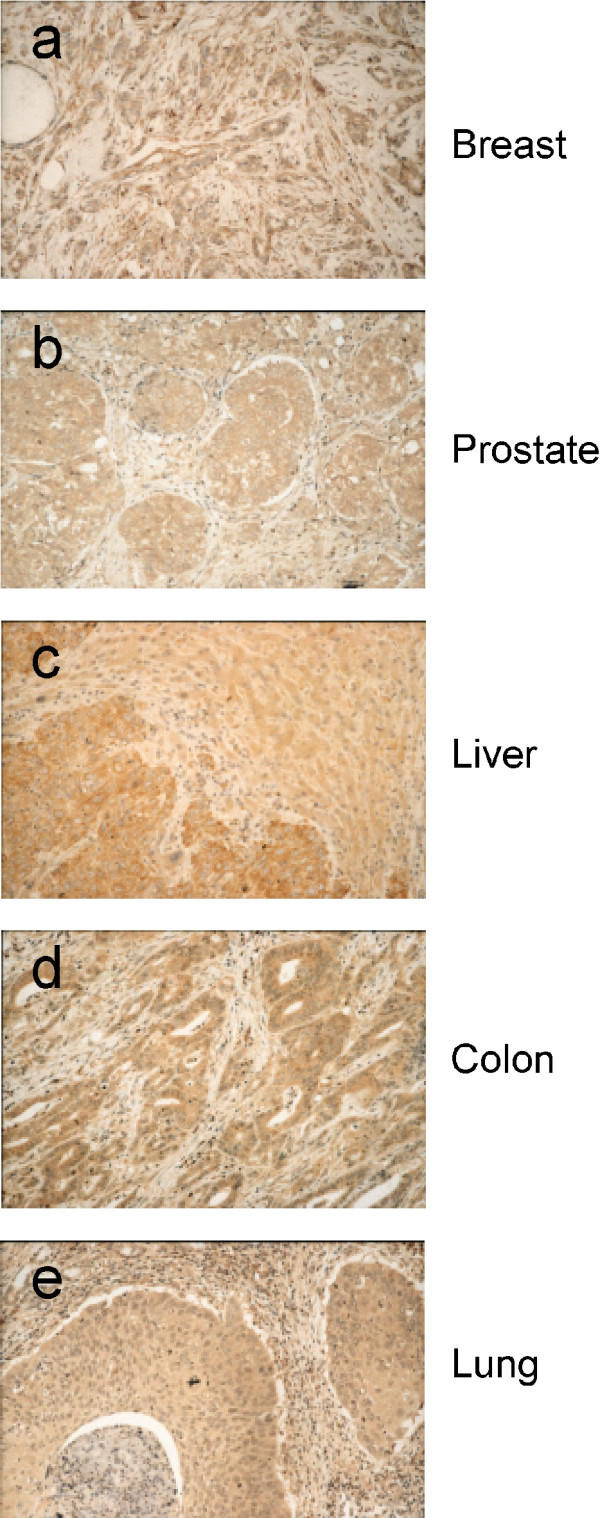
Results: The use of reverse transcription real-time PCR and specifically generated monoclonal anti-Eag1 antibodies showed that expression of the channel is normally limited to specific areas of the brain and to restricted cell populations throughout the body. Tumour samples, however, showed a significant overexpression of the channel with high frequency (up to 80% depending on the tissue source) regardless of the detection method (staining with either one of the antibodies, or detection of Eag1 RNA).

Conclusion: Inhibition of Eag1 expression in tumour cell lines reduced cell proliferation. Eag1 may therefore represent a promising target for the tailored treatment of human tumours. Furthermore, as normal cells expressing Eag1 are either protected by the blood-brain barrier or represent the terminal stage of normal differentiation, Eag1 based therapies could produce only minor side effects.


Figures

Figure 1
Figure 1
Characterization of the Eag1 antibodies. a. Western blot analysis of Eag1-expressing membrane preparations with anti-Eag1.62.mAb. A single protein is detected only when using large amounts of brain extract protein. b. Eag1.62.mAb stained CHO cells transfected with Eag1 (left) while cells transfected with Eag2 (right) show only faint background, indicating that Eag1.62.mAb does not recognise Eag2. c. CHO cells transiently expressing a chimera between EGFP and hEag1. Chimeras were stained with Eag1.62.mAb. The green fluorescence due to the presence of the chimera (upper left panel, marked EGFP) matches the staining pattern of the antibody (upper right panel, marked Eag1.62.mAb), as seen as yellow colour in the merged pseudo-colour image (lower panel, marked Overlay) Scale Bar: 20 μm. d-g. Light micrographs showing the immunohistochemical reaction for the monoclonal antibodies in rat hippocampus (d, Eag1.62.mAb; e, Eag1.33.mAb) and cerebellum (f, Eag1.62.mAb; g, Eag1.33.mAb), with (right column) and without (left column) pre-adsorption of the antibody to the corresponding fusion protein. The staining patterns are identical for both antibodies and are fully blocked by incubation with the corresponding epitopes, indicating that both antibodies specifically recognise the same molecular entity. Scale Bar: 50 μm.
Figure 2
Figure 2
Expression of Eag1 RNA in peripheral tissues is restricted. Real-time PCR records on cDNA from different human RNAs. The average fluorescence obtained in three experiments (± standard error) is plotted against cycle number. The dotted line indicates the threshold values used to determine positive signals. A clear signal can be detected after 21 cycles only in brain (red diamonds), while testis (dark green circles) and adrenal glands (light green triangles) required several more cycles of amplification for the signal to reach threshold. The rest of the tissues were negative. The Inset shows the control amplification obtained simultaneously on the same samples using the human transferrin receptor (TFR) as a template to demonstrate RNA integrity.
Figure 3
Figure 3
Some normal tissues show Eag1 staining in restricted populations. In the female reproductive system, the follicular epithelia (a) do not show Eag1-staining. The surface and gland epithelia of the resting endometrium are also negative (b). However, in proliferating and secretory activated glands, a strong Eag1-expression can be observed (b. Inset). In the healthy mammary gland (c), Eag1 signals are limited to luminal cells in the acini and ducts of the ductulo-lobular unit, while the basal cell layer is negative (arrow). In the testis (d), interstitial cells and spermatogonia within the ducti seminiferi show a weak to intermediate Eag1 expression. (e) The gastric corpus mucosa express little or no Eag1 (white arrow) except in chief cells (black arrow) where very strong signals are observed. In colon (f), the normal mucosa is negative, while mucosa-associated lymphocytes stain positive.
Figure 4
Figure 4
Eag1 RNA is present in mammary tumours. Real-time PCR amplification reveals increased Eag1 expression on cDNA obtained from human mammary gland tumours (red trace, N = 11), as compared with paired RNAs (filled black circles) from three of the cases (since only those samples were available) and commercially available normal mammary epithelium RNA (open circles designated comm. gland RNA). Data points represent average fluorescence units from the reporter fluorophore versus PCR cycle number. Error bars represent standard error.
Figure 5
Figure 5
Representative images of neoplastic tissue: Immunoperoxidase stainings using Eag1.62mAb as primary antibody. Examples of high expression levels of Eag1 in mammary carcinoma (a), prostate carcinoma (b), hepatocellular carcinomas (c) colon carcinoma (d) or squamous cell lung carcinoma (e) (Hematoxylin counterstain, ×400).
Figure 6
Figure 6
Representative images of neoplastic tissue stained with alkaline phosphatase coupled to anti Eag1 single chain antibody. (a) Ductal-invasive mammary carcinoma (b) Lung carcinoma (squamous cell). (c) Prostate carcinoma.

Similar articles

Cited by

References

    1. Hille B. Ion channels of excitable membranes, Third Edition. Sunderland, Massachussets , Sinauer Associates Inc.; 2001.
    1. Pardo LA, Contreras-Jurado C, Zientkowska M, Alves F, Stuhmer W. Role of voltage-gated potassium channels in cancer. J Membr Biol. 2005;205:115–124. doi: 10.1007/s00232-005-0776-1. - DOI - PubMed
    1. Pardo LA. Voltage-gated Potassium Channels in Cell Proliferation. Physiology. 2004;19:285–292. doi: 10.1152/physiol.00011.2004. - DOI - PubMed
    1. Stühmer W, Alves F, Hartung F, Zientkowska M, Pardo LA. Potassium channels as tumour markers. FEBS Lett. 2006;580:2850–2852. doi: 10.1016/j.febslet.2006.03.062. - DOI - PubMed
    1. Conti M. Targeting K+ channels for cancer therapy. J Exp Ther Oncol. 2004;4:161–166. - PubMed

Publication types

MeSH terms

LinkOut - more resources