. 2007 Feb 1;302(1):104-17.
doi: 10.1016/j.ydbio.2006.09.008. Epub 2006 Sep 12.

Selective degradation of transcripts during meiotic maturation of mouse oocytes

Affiliations

Selective degradation of transcripts during meiotic maturation of mouse oocytes

You-Qiang Su et al. Dev Biol. .

Abstract

There is massive destruction of transcripts during the maturation of mouse oocytes. The objective of this project was to identify and characterize the transcripts that are degraded versus those that are stable during the transcriptionally silent germinal vesicle (GV)-stage to metaphase II (MII)-stage transition using a microarray approach. A system for oocyte transcript amplification using both internal and 3'-poly(A) priming was utilized to minimize the impact of complex variations in transcript polyadenylation prevalent during this transition. Transcripts were identified and quantified using the Affymetrix Mouse Genome 430 v2.0 GeneChip. The significantly changed and stable transcripts were analyzed using Ingenuity Pathways Analysis and GenMAPP/MAPPFinder to characterize the biological themes underlying global changes in oocyte transcripts during maturation. It was concluded that the destruction of transcripts during the GV to MII transition is a selective rather than promiscuous process in mouse oocytes. In general, transcripts involved in processes that are associated with meiotic arrest at the GV-stage and the progression of oocyte maturation, such as oxidative phosphorylation, energy production, and protein synthesis and metabolism, were dramatically degraded. In contrast, transcripts encoding participants in signaling pathways essential for maintaining the unique characteristics of the MII-arrested oocyte, such as those involved in protein kinase pathways, were the most prominent among the stable transcripts.


Figures

Fig. 1
Fig. 1
Distribution of transcripts at various magnitudes of difference in expression levels between MII and GV oocytes. Transcripts, as represented by Affymetrix probe sets, were categorized by fold-changes in expression levels between MII and GV oocytes. Only transcripts that were detected in either GV or MII oocytes as determined by an Affymetrix “P” call as defined in the Methods section were subjected to the analysis. The number on the top of each bar indicates the percentage of each corresponding group of transcripts in total. The shaded portion of each bar indicates the number of transcripts whose expression levels in MII oocytes were different from GV oocytes as determined by FWER p-value <0.05.
Fig. 2
Fig. 2
Real-time RT-PCR analysis of transcripts selected from microarray expression profiles. Five categories (A–E) of transcripts were selected for real-time RT-PCR analysis. (A): Transcripts that are normally expressed in expanded cumulus oophorus but not oocytes; (B): Transcripts known to be polyadenylated in MII oocytes; (C): Transcripts that are oocyte-specific or highly expressed in oocyte; (D): Transcripts that are shown by microarray to be artifactually up-regulated; (E): Transcripts that are shown by microarray to be significantly degraded in MII oocytes. Four sets of samples with equal number of GV and MII oocytes were used for real-time RT-PCR analysis and data are presented as Mean ± SEM of Log2 transformed fold changes. *: p < 0.05; MII vs. GV. ND: not detectable.
Fig. 3
Fig. 3
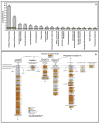
Canonical pathways associated with the degraded transcripts during oocyte maturation. (A): All the pathways identified by IPA that are associated with the degraded transcripts. A larger value on the y-axis indicates a higher degree of significance, i.e., a smaller P value. The dark horizontal line crossing all the bars indicates the threshold of significance (p = 0.05), bars above this line have a p value of less than 0.05. The number of degraded transcripts that are involved in each pathway is shown above the bars. (B): GenMAPP display of degraded transcripts participating in the oxidative phosphorylation pathway. The list of all the genes detected in either GV or MII oocytes was uploaded in GenMAPP, and the significantly downregulated transcripts were defined by the criteria of FWER p-value <0.05 and FC (fold change) <−1, and were shown in boxes that were marked in orange. The stable transcripts were defined by the criteria as described in Material and Methods, and are indicated in yellow. The transcripts that were up-regulated in MII oocytes as defined by the criteria of FWER p-value <0.05 and FC (fold change) > 1, and are indicated in green. These designations for presenting data derived from IPA and GenMAPP analyses were also applied in Figs. 4 and 5.
Fig. 4
Fig. 4
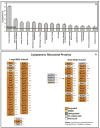
Biological functions associated with the degraded transcripts during oocyte maturation. (A): Biological functions identified by IPA that were associated with the degraded transcripts. The number of degraded transcripts involved in each function is indicated above the bars. There were 26 functions in total being identified to be associated with the degraded transcripts, and only the top 15 is shown here. (B): GenMAPP display of degraded transcripts encoding cytoplasmic ribosomal proteins.
Fig. 5
Fig. 5
Canonical pathways associated with the stable transcripts during oocyte maturation. (A): Pathways identified by IPA that are associated with the stable transcripts. The number of stable transcripts involved in each pathway is shown above the bars. There were 30 canonical pathways in total being identified to be associated with the degraded transcripts, and only the top 15 is shown here. (B): GenMAPP display of transcripts participating in the MAPK signaling pathway.

Similar articles

Cited by

References

    1. Bachvarova R, De Leon V, Johnson A, Kaplan G, Paynton BV. Changes in total RNA, polyadenylated RNA, and actin mRNA during meiotic maturation of mouse oocytes. Dev Biol. 1985;108:325–31. - PubMed
    1. Bettegowda A, Patel OV, Ireland JJ, Smith GW. Quantitative analysis of messenger RNA abundance for ribosomal protein L-15, cyclophilin-A, phosphoglycerokinase, beta-glucuronidase, glyceraldehyde 3-phosphate dehydrogenase, beta-actin, and histone H2A during bovine oocyte maturation and early embryogenesis in vitro. Mol Reprod Dev. 2006;73:267–78. - PubMed
    1. Biggers JD, Whittingham DG, Donahue RP. The pattern of energy metabolism in the mouse oocyte and zygote. Proc Nat Acad Sci (USA) 1967;58:560–567. - PMC - PubMed
    1. BouniolBaly C, Hamraoui L, Guibert J, Beaujean N, Szollosi MS, Debey P. Differential transcriptional activity associated with chromatin configuration in fully grown mouse germinal vesicle oocytes. Biol Reprod. 1999;60:580–587. - PubMed
    1. Buratini J, Jr, Teixeira AB, Costa IB, Glapinski VF, Pinto MG, Giometti IC, Barros CM, Cao M, Nicola ES, Price CA. Expression of fibroblast growth factor-8 and regulation of cognate receptors, fibroblast growth factor receptor-3c and -4, in bovine antral follicles. Reproduction. 2005;130:343–50. - PubMed

Publication types