. 2006 Dec 8;281(49):37904-12.
doi: 10.1074/jbc.M606888200. Epub 2006 Oct 5.

A small molecule agonist of an integrin, alphaLbeta2

Affiliations

A small molecule agonist of an integrin, alphaLbeta2

Wei Yang et al. J Biol Chem. .

Abstract

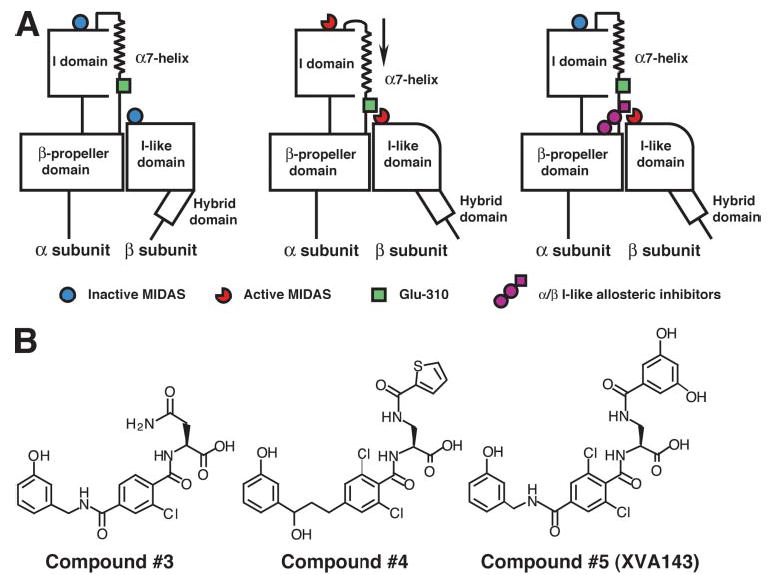
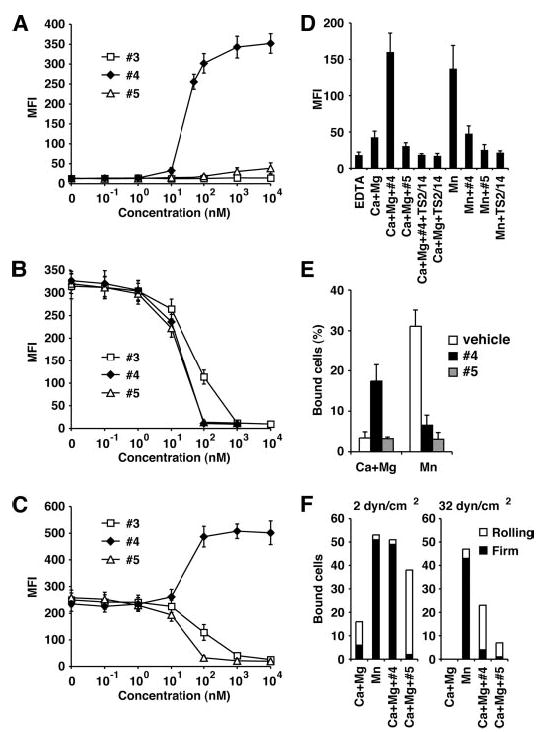
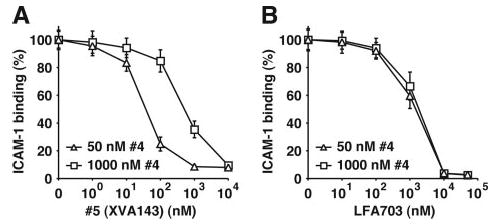
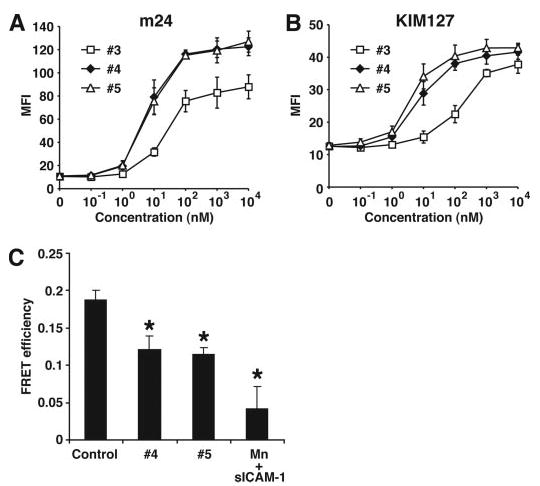
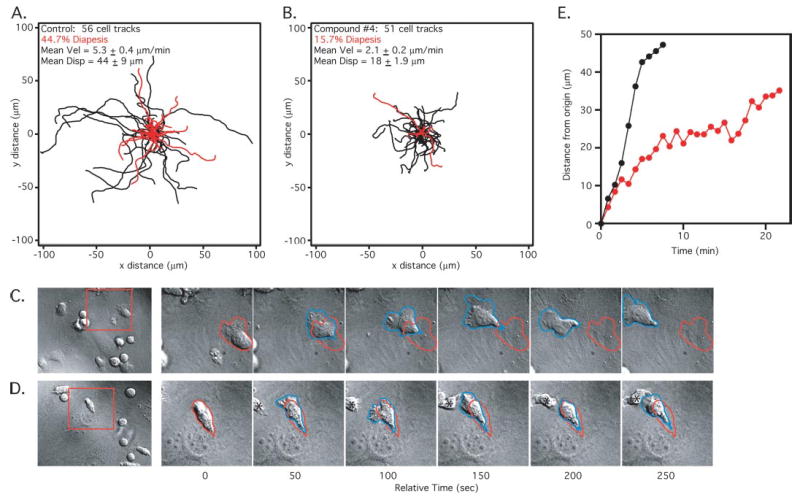
The binding of integrin alpha(L)beta(2) to its ligand intercellular adhesion molecule-1 is required for immune responses and leukocyte trafficking. Small molecule antagonists of alpha(L)beta(2) are under intense investigation as potential anti-inflammatory drugs. We describe for the first time a small molecule integrin agonist. A previously described alpha/beta I allosteric inhibitor, compound 4, functions as an agonist of alpha(L)beta(2) in Ca(2+) and Mg(2+)and as an antagonist in Mn(2+). We have characterized the mechanism of activation and its competitive and noncompetitive inhibition by different compounds. Although it stimulates ligand binding, compound 4 nonetheless inhibits lymphocyte transendothelial migration. Agonism by compound 4 results in accumulation of alpha(L)beta(2) in the uropod, extreme uropod elongation, and defective de-adhesion. Small molecule integrin agonists open up novel therapeutic possibilities.


Figures

FIGURE 1
FIGURE 1. Mechanisms of inhibition and chemical structures of α/βI allosteric antagonists
A, mechanisms of inhibition and impact on integrin conformation of α/βI allosteric antagonists. α/βI allosteric inhibitors bind to the β2 I domain MIDAS near a key regulatory interface with the αL I domain and block communication of conformational change to the I domain while at the same time activating conformational rearrangements elsewhere in integrins, including swing-out of the hybrid domain. B, chemical structures of α/βI allosteric antagonists.
FIGURE 2
FIGURE 2. Compound 4 inhibits α Lβ2 in Mn2+ but activates αLβ2 in Ca2+ and Mg2+
A–C, soluble multimeric ICAM-1 binding by K562 stable transfectants expressing wild-type αLβ2. Cells were incubated with compounds in Hepes, NaCl, glucose, bovine serum albumin supplemented with 1 mM CaCl2 and 1 mM MgCl2 (A), 2 mM MnCl2 (B), or 1 mM CaCl2, 1 mM MgCl2, and 10 μg/ml CBR LFA-1/2 (C) for 30 min at room temperature. Then fluorescein isothiocyanate-labeled multimeric ICAM-1 was added and incubated with cells for another 30 min at room temperature. The binding was detected by flow cytometry and is expressed as mean fluorescence intensity (MFI). D, soluble multimeric ICAM-1 binding by human PBMCs. Binding was assayed as in A–C with cations, compounds (1 μM), and TS2/14 mAb (10 μg/ml) as indicated. E, static adhesion of αLβ2-expressing K562 cells to immobilized ICAM-1 was as described in “Experimental Procedures” with cations and compounds (1 μM) as indicated. F, adhesion in shear flow of αLβ2-expressing K562 cells to immobilized ICAM-1. K562 cells expressing wild-type αLβ2 were incubated in media containing different divalent cations and compounds (1 μM) as above. Cells were allowed to accumulate on an ICAM-1-Fc-coated substrate at 0.3 dyn/ cm2 in the flow chamber for 30 s before increasing the flow rate every 10 s in about 2-fold increments to the indicated wall shear stresses. Bars show the total number of adherent cells, including cells that were rolling (white) or firmly adherent (black).
FIGURE 3
FIGURE 3. Inhibition of agonism by compound 4 with compound 5 and LFA703
Soluble, multimeric ICAM-1 binding by αLβ2-expressing K562 cells was determined as described in Fig. 2A in 1 mM CaCl2, 1 mM MgCl2 after co-incubation with the indicated concentrations of compound 4 and compound 5 (A) or LFA703 (B).
FIGURE 4
FIGURE 4. Compound 4 and Mn2+ activate αLβ2 by different mechanisms
Soluble ICAM-1 binding by K562 transfectants expressing wild-type or mutant αLβ2 was as described in Fig. 2A in the presence of cations and compounds (1 μM) as indicated. MFI, mean fluorescence intensity.
FIGURE 5
FIGURE 5. Effect of compounds on the conformation of αLβ2
A and B, effect of compounds on expression of activation epitopes on αLβ2. αLβ2-Expressing K562 cells were stained with m24 (A) or KIM127 (B) in Hepes buffer containing 1 mM CaCl2, 1 mM MgCl2 and compounds at 37 °C for 30 min followed by immunofluorescence flow cytometry. C, binding of compounds induces spatial separation of αLβ2 cytoplasmic domains. FRET was measured in αL-mCFP/β2-mYFP K562 transfectants after treatment with compounds (1 μM) or 1 mM Mn2+ and soluble monomeric ICAM-1 (slCMA-1) 100 μg/ml) as indicated. Data are the mean ± S.E. for 8 to 10 cells. *, p < 0.05 versus control. MFI, mean fluorescence intensity.
FIGURE 6
FIGURE 6. Effect of compounds on lymphocyte diapedesis
Interleukin-2-cultured human lymphocytes were incubated with TNF-αactivated HUVEC monolayers for 10 or 60 min (A) or 10 min (B–D) in the absence or presence of compounds or CBR LFA-1/2 Fab, fixed, and stained as described under “Experimental Procedures.” For each experiment a minimum of 100 lymphocytes from randomly selected fields were carefully analyzed to determine stage of diapedesis and morphology as described under “Experimental Procedures.” A, quantitation of transendothelial migration (TEM). The number of cells having either initiated or completed diapedesis is expressed as a percentage of total cells. Values represent mean ± S.E. of 3–6 independent experiments. DMSO, dimethyl sulfoxide. B–D, morphologic characterization of lymphocytes. Lymphocytes and HUVECs were fixed and stained for αL integrin (green) and F-actin (red). Representative micrographs demonstrate each of four principal morphologic categories (round, spread, polarized, and X-polarized) observed among the apically adherent cells. C, the number of cells displaying each of the morphologies is expressed as a percentage of the total. Values represent mean ± S.E. of 3–8 experiments. D, representative fields used for the quantitation shown in C.
FIGURE 7
FIGURE 7. Dynamics of lymphocyte lateral migration and diapedesis across endothelium
Live-cell imaging and analysis of lymphocytes migrating on TNF-α-activated HUVEC monolayers was as described under “Experimental Procedures.” For each condition, greater than 50 cells, taken from four separate imaging experiments (see representative experiments in supplemental Videos 1 and 2) were analyzed. A and B, two-dimensional tracks of lymphocytes migrating over a 30-min period under control conditions (A) and in the presence of 1 μM compound 4 (B). Tracks of cells that initiated diapedesis during the imaging time course are terminated at the point of initiation of diapedesis and are depicted in red. C–E, kinetics of migration of representative lymphocytes. C–D, left panels are selected frames from representative live-cell imaging experiments under control condition (C, see Video 1) and in the presence of compound 4 (D, see Video 2). Representative cells (boxed region in left panels) were tracked at 50-s intervals. The outline (red) of the cell position at relative time 0 is shown in all panels. Note that in control condition (C) the migrating cell steadily increases its distance from its origin over time, whereas in the presence of compound 4 (D) the cell repeatedly moves away from and then contracts back toward the origin. E, the distances from the origin of the centroids of the two migrating cells shown in C and D are plotted against time for control (black) and compound 4 (red) conditions. The control cell is only tracked for 7 min because after this it left the boxed region in Fig. 7C.

References

    1. Anderson DC, Smith CW, Springer TA. In: Metabolic Basis of Inherited Disease. 6th Ed. Stanbury JB, Wyngaarden JB, Frederickson DS, editors. McGraw-Hill; New York: 1989. pp. 2751–2777.
    1. Springer TA. Nature. 1990;346:425–433. - PubMed
    1. Harlan JM, Winn RK, Vedder NB, Doerschuk CM, Rice CL. In: Adhesion: Its Role in Inflammatory Disease. Harlan JR, Liu D, editors. W. H. Freeman and Co.; New York: 1992. pp. 117–150.
    1. Giblin PA, Kelly TA. Annu Rep Med Chem. 2001;36:181–190.
    1. Yusuf-Makagiansar H, Anderson ME, Yakovleva TV, Murray JS, Siahaan TJ. Med Res Rev. 2002;22:146–167. - PubMed

Publication types

MeSH terms

Substances